❌

Reading view

Apple in China Is Its Greatest Opportunity and Hardest Test

Apple in China occupies a position unlike the company’s presence in any other country. China is simultaneously a major consumer market, a critical manufacturing center, an extensive developer economy and the home of Apple’s most determined hardware competitors.

That combination creates an opportunity few technology companies can ignore. China has hundreds of millions of affluent mobile users, a strong appetite for premium devices and a digital economy built around smartphones.

It also creates unusual complexity. Apple must compete with Huawei, Xiaomi, Oppo and Vivo while satisfying Chinese regulations, navigating tensions between Beijing and Washington and reducing its manufacturing dependence without damaging the supplier network that helped make the iPhone possible.

The latest market figures show why Apple cannot treat China as a business it has already lost. IDC estimated that Apple captured 18.1 percent of Chinese smartphone shipments during the second quarter of 2026, placing it second behind Huawei at 22.6 percent.

Apple’s shipments increased by 24.4 percent from the previous year even as the wider Chinese smartphone market contracted. The recovery demonstrated that Chinese demand for the iPhone remains substantial when product design, storage, performance and pricing align with consumer expectations.

The same figures also show why the position can never be considered secure. Huawei remains ahead, local brands respond quickly and a few percentage points can separate several major vendors.

Apple in China Still Has Room to Grow

China is already one of Apple’s largest markets, but its scale means that even established product categories contain room for expansion.

The country has a large premium smartphone segment, extensive 5G coverage and consumers accustomed to using mobile devices for communication, payments, shopping, entertainment, transport and work.

An iPhone purchase can also lead to AirPods, Apple Watch, iPad, Mac, iCloud storage and paid applications. The commercial opportunity is therefore larger than the initial handset transaction.

Apple’s strongest advantage is its integrated ecosystem. An iPhone can share passwords, photographs, messages and files with a Mac or iPad, while AirPods and Apple Watch extend the experience without requiring separate accounts and setup systems.

That continuity becomes more valuable as households accumulate devices. Replacing one iPhone is relatively easy. Leaving an ecosystem containing several products, purchased applications, cloud storage and shared family services involves greater friction.

Apple also benefits from a premium identity that remains recognizable in China. Local manufacturers now produce sophisticated flagship phones, but the iPhone continues to operate as both a personal computer and a luxury consumer product.

The importance of that status should not be exaggerated. Chinese buyers are technically informed and increasingly willing to support domestic brands. Brand recognition can attract attention, but it does not excuse weak features or an uncompetitive product cycle.

China Flag

Recent iPhone Demand Shows the Opportunity

Apple’s 2026 recovery offers a useful example of how quickly its position can improve.

China’s smartphone shipments fell 4.3 percent during the second quarter as memory and component costs pushed several manufacturers toward higher prices. Apple and Huawei held prices more stable, giving buyers a reason to purchase while competing brands became more expensive.

The iPhone 17 generation also addressed several areas where Apple’s standard models had appeared conservative beside Chinese flagships. Stronger base specifications made the regular iPhone more competitive without requiring every customer to move into the Pro tier.

This matters in a market where consumers compare display technology, camera systems, storage, battery life, charging and AI features closely. Apple cannot depend entirely on iOS loyalty when domestic companies introduce visible hardware improvements at several price levels.

The rebound does not establish a permanent trend. Smartphone demand in China remains affected by economic confidence, upgrade cycles, government incentives and the timing of major shopping festivals.

Apple’s position can also look different according to the research firm and whether a report measures shipments or consumer sales. Quarterly rankings should be treated as evidence of momentum rather than a final judgment on the market.

The important signal is that Chinese consumers have not broadly rejected the iPhone. Demand can return rapidly when the product and price create a convincing upgrade.

Huawei Makes China Apple’s Hardest Market

Huawei gives Apple a competitor with advantages unavailable to most global smartphone manufacturers.

The company combines strong national recognition with advanced cameras, communications technology, custom chips, local services and an expanding HarmonyOS ecosystem. Its return to premium smartphones removed the opening Apple had gained when U.S. restrictions disrupted Huawei’s access to important components.

Huawei can also position its products as part of China’s technological self-reliance. That message carries commercial and political weight beyond a conventional comparison between two phones.

Apple must therefore compete against product quality and national sentiment simultaneously. An iPhone can offer strong performance and still lose a purchase to a domestic flagship viewed as technically capable and strategically important.

Xiaomi, Oppo and Vivo add different pressures. They move quickly across price categories, experiment with folding designs, adopt larger batteries and provide features adapted to local applications and buying habits.

Chinese phone makers also operate inside a retail and software environment they understand directly. They can build relationships with local platforms, carriers and commerce services without translating a global strategy into Chinese requirements.

Apple follows a more centralized product model. That consistency protects the identity of the iPhone, but it can make the company slower to answer features gaining popularity inside one country.

A sleek Apple Store with a minimalist design, featuring a large illuminated Apple logo at the entrance. People casually walk around the spacious interior with wooden tables displaying Apple products and brightly lit walls adorned with images. Significant iPhone discounts in China have driven a sales surge.

Services Depend on Local Rules

Apple in China is not only an iPhone business. The installed device base creates demand for applications, cloud storage, entertainment, subscriptions and digital purchases.

China has an enormous developer community producing games, commerce platforms, social services, education tools and productivity software. The App Store connects those developers with high-value iPhone and iPad customers.

The relationship is commercially important but politically complicated. Apple must operate the mainland App Store according to Chinese law, including rules affecting games, generative AI, communications services and content.

Applications available elsewhere may be absent from the Chinese storefront. Developers may also need licenses or regulatory approval before distributing certain categories of software.

Apple changed commission rates and related policies for the mainland China storefront in March 2026. The company described the adjustments as part of maintaining a strong business opportunity for Chinese developers.

Regulatory and developer pressure has not disappeared. Complaints involving commissions, distribution restrictions and payment policies continue to challenge Apple’s control of the platform.

The company cannot simply copy its response from another region. European rules focus heavily on alternative marketplaces and interoperability, while China combines competition concerns with content regulation, data localization and licensing requirements.

Every concession must therefore be designed for a distinct legal environment without fragmenting iOS into an unmanageable collection of regional systems.

China Is Also Part of the Product

Apple’s relationship with China extends far beyond the devices sold there.

For more than two decades, Apple and its manufacturing partners built a dense network of factories, component suppliers, engineers, logistics operators and toolmakers across the country.

That network does more than provide low-cost labor. It can place specialists from several suppliers near an assembly site, modify production lines quickly and increase output to enormous volumes during a product launch.

China’s infrastructure also supports the less visible stages of manufacturing. Components require precision tooling, testing equipment, chemicals, packaging, subassemblies and experienced quality-control teams before final assembly begins.

Apple has expanded iPhone production in India and moved parts of its Mac, iPad, Apple Watch and AirPods supply chains to countries including Vietnam. It is also increasing semiconductor and component commitments in the United States.

Those investments reduce the danger of relying on one country, but they do not recreate China’s complete manufacturing environment immediately.

A factory in another region may assemble an iPhone while still depending on Chinese machinery, materials, subcomponents or engineering support. Production diversification is therefore a gradual redistribution of individual stages rather than a clean departure.

Apple must reduce concentration risk without weakening the manufacturing system responsible for its product quality, scale and launch schedules.

Several new smartphones in various colors are displayed upright on stands, with their screens facing forward. The background is blurred, drawing focus to the phones amid discussions around Apple EU antitrust regulations.
Image Credit: AFP Photo

Trade Tensions Turn Efficiency Into Risk

The same China supply chain that provides Apple with extraordinary efficiency also exposes the company to political decisions outside its control.

Tariffs can raise the cost of devices exported from Chinese factories. Export restrictions can limit access to materials or production equipment, while sanctions may affect suppliers and technology partners.

Chinese government policies can influence the use of foreign devices inside state agencies and companies. U.S. rules can restrict the technologies available to Chinese firms that also participate in Apple’s supplier network.

Apple cannot solve these problems through product design alone. It must maintain relationships with two governments whose technology policies increasingly emphasize security, domestic production and strategic independence.

Moving more assembly to India gives Apple additional flexibility, particularly for iPhones destined for the United States. China nevertheless remains important as a production center and consumer market.

An aggressive withdrawal could damage supplier relationships and local sales. Moving too slowly could leave Apple vulnerable to another trade disruption.

The company is trying to preserve Chinese capabilities while creating enough capacity elsewhere to keep a political dispute from becoming a worldwide product shortage.

Retail Stores Give Apple a Direct Relationship

Apple’s physical stores remain an important advantage in China because they give the company direct contact with customers.

The stores allow buyers to compare models, receive technical support, attend educational sessions and enter the ecosystem without depending entirely on a carrier or reseller.

That experience is particularly valuable for premium products. A customer considering a Mac, Apple Vision Pro or high-end iPhone may need more explanation than someone replacing an inexpensive handset.

Retail locations also communicate long-term commitment. A prominent store represents more than a sales channel; it signals that Apple intends to remain part of the local technology market.

Online commerce is equally important. Chinese consumers are accustomed to large shopping festivals, aggressive promotions and rapid delivery through domestic platforms.

Apple must balance its controlled global pricing with a market where discounts can change quarterly rankings. Too little flexibility makes the iPhone appear expensive, while frequent reductions can train customers to delay purchases and weaken its premium image.

The strongest 2026 performance came partly from avoiding price increases while component costs were forcing rivals to reconsider their pricing. That advantage may disappear when competitors adjust their supply chains or launch another cycle of promotions.

Chinese Consumers Set a Higher Product Standard

China is often discussed as a sales problem for Apple, but it also functions as a demanding test of the iPhone.

Domestic flagship phones compete through larger batteries, rapid charging, advanced camera hardware, folding displays and deep integration with local digital services.

Features considered experimental elsewhere can become established expectations more quickly in China. Apple’s slower adoption cycle may look disciplined in one market and conservative in another.

The company must decide which expectations represent durable improvements and which are temporary specification contests. Copying every local feature would weaken Apple’s focused product strategy, but ignoring major changes creates openings for rivals.

This pressure can benefit Apple globally. Competition in China forces the company to defend the value of its standard iPhone, improve battery efficiency, strengthen cameras and make software features more useful outside English-speaking markets.

The opportunity is therefore not limited to selling more devices. China can reveal where Apple’s global assumptions no longer match the most competitive part of the smartphone industry.

The post Apple in China Is Its Greatest Opportunity and Hardest Test appeared first on AppleMagazine.
  •  

Rocks From the Moon’s Far Side Are Rewriting Lunar History

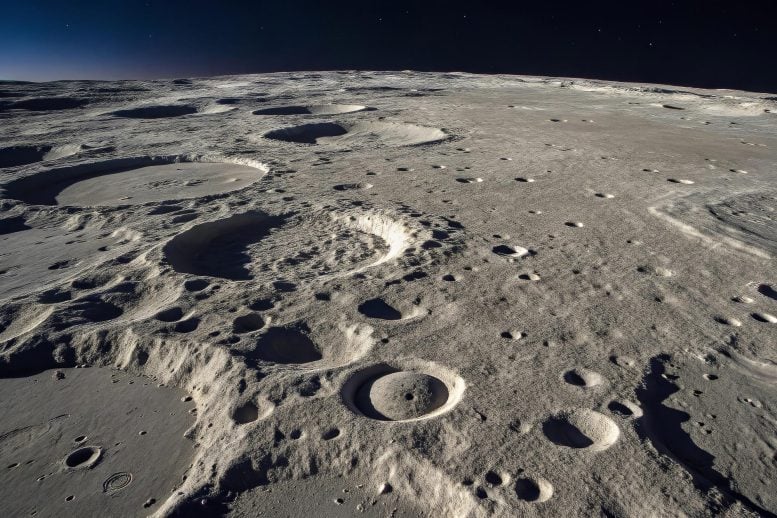
Moon Surface DetailsThe Moon’s far side is overturning a long-held theory, revealing that the early Solar System’s asteroid assault may have faded slowly instead of exploding in one catastrophic burst. For decades, scientists have debated whether the early Solar System endured one sudden, catastrophic wave of asteroid strikes or a much longer period of gradually fading violence. [...]
  •  

Dinosaur-killing asteroid may have caused firestorms 17 times hotter than the thermal limit lethal to humans

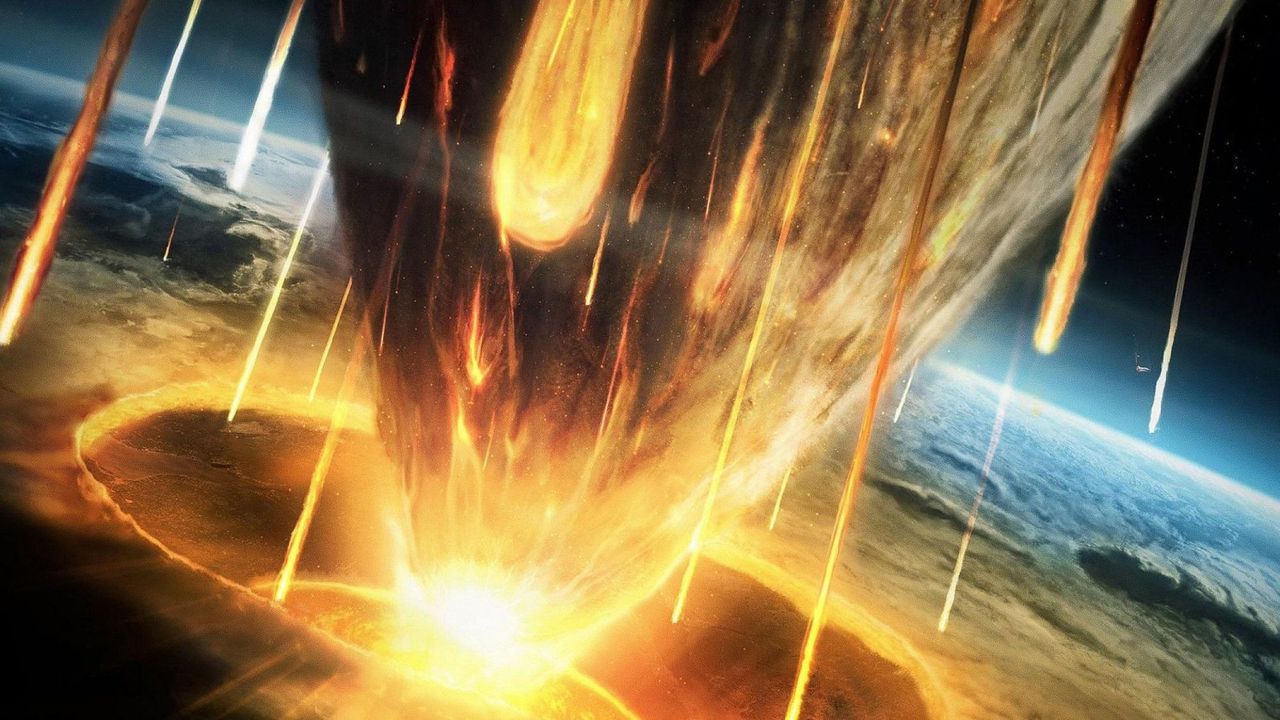
Scientists once suspected that a brutal, years-long winter starved the dinosaurs following an asteroid impact 66 million years ago. New evidence suggests a more violent end: widespread firestorms that may have burned even thick-skinned dinosaurs to a crisp within hours.

The roughly six-mile-wide (10-kilometer-wide) asteroid struck Mexico's Yucatán Peninsula, excavating the Chicxulub crater and vaporizing enormous quantities of rock. Some of that material condensed into tiny droplets called spherules, which spread around the planet before falling back through Earth's atmosphere at several miles per second.

As the spherules slowed, their kinetic energy became heat, producing an intense pulse of thermal radiation. Earlier models suggested the effect would have resembled a worldwide broiler that was potentially deadly to exposed, thin-skinned animals, but not powerful enough to ignite vegetation across the globe.

A new study argues that those calculations overlooked a crucial ingredient: a thick layer of fine silicate dust formed from rock vapor that did not initially condense into spherules. Evidence for that dust emerged in 2023 from the Tanis fossil site in North Dakota, where researchers identified a layer of extremely fine, impact-derived material deposited above the spherules. A similar dust layer has since been documented at the K–Pg boundary (which divides the "age of reptiles" and the "age of mammals") in Raton Basin across the Colorado–New Mexico border.

"It reinvigorated my interest in what happened to the leftover vapor — that's where this work started," lead author Brandon Johnson, a planetary scientist at Purdue University, said in a statement.

The dust would have acted like an insulating blanket, preventing thermal radiation from escaping into space and redirecting more heat toward Earth’s surface. The researchers estimated that the surface heat pulse could have been about 3.5 times more intense than what was suggested by models considering the falling spherules alone. "We're in the realm where we might be essentially killing off everything within that first hour or two," Johnson said.

The radiation may not have directly ignited thick pieces of wood, but it exceeded ignition thresholds for grass, lichen, and pine needles, which could have fueled larger fires. The study also found that exposed terrestrial animals may have received about 17 times the thermal dose considered lethal to humans.

Animals sheltering underground or in water would have had a better chance of surviving the initial heat pulse. Afterward, the same dust may have blocked sunlight for years, triggering the prolonged "impact winter" more typically blamed for the dinosaurs' extinction.

There is, however, a missing element: the wildfire evidence that supports this dust-caused inferno theory has only been found in North America. "It could be that we will eventually find the record of completely global wildfires," said Alfio Alessandro Chiarenza, a paleontologist at University College London who was not involved in the study. "We just don't have it so far."

The study was published on July 28 in the journal JGR Biogeosciences.

  •  

iCloud Storage

My husband and I have iMacs, iPhones, iPads. We've never subscribed to an iCloud plan. We use DropBox for storing many files (I have Screenshot 2026-07-30 at 2.48.01 PM.jpg a large amount because I tested for them in the beginning.
I routinely delete emails when they are not needed, delete sent mails after a few days, etc. I empty the trash almost every day. We store photos in Google Photos and Amazon photos,
My husband doesn't do this.

Recently he somehow lost many emails relating to an upcoming trip. (It occurred...

Read more
  •  

What’s Up: August 2026 Skywatching Tips from NASA

A solar eclipse, the Perseids, bright Venus after sunset, and a deep partial lunar eclipse highlight August’s skywatching.

Skywatching Highlights

  • Aug. 5: Last Quarter Moon
  • Aug. 12: Total solar eclipse across northern Russia, Greenland, Iceland, northern Spain, and part of Portugal; partial eclipse in parts of the U.S.; New Moon
  • Aug. 12-13: Perseid meteor shower peak under dark skies
  • Aug. 14-16: Venus reaches greatest eastern elongation and shines low in the west after sunset
  • Aug. 27-28: Partial lunar eclipse visible from much of North and South America and parts of Europe and Africa

Transcript

A solar eclipse, one of the year’s best meteor showers, Venus at its brightest in the evening sky, and a lunar eclipse to close out the month.

That’s “What’s Up” for August.

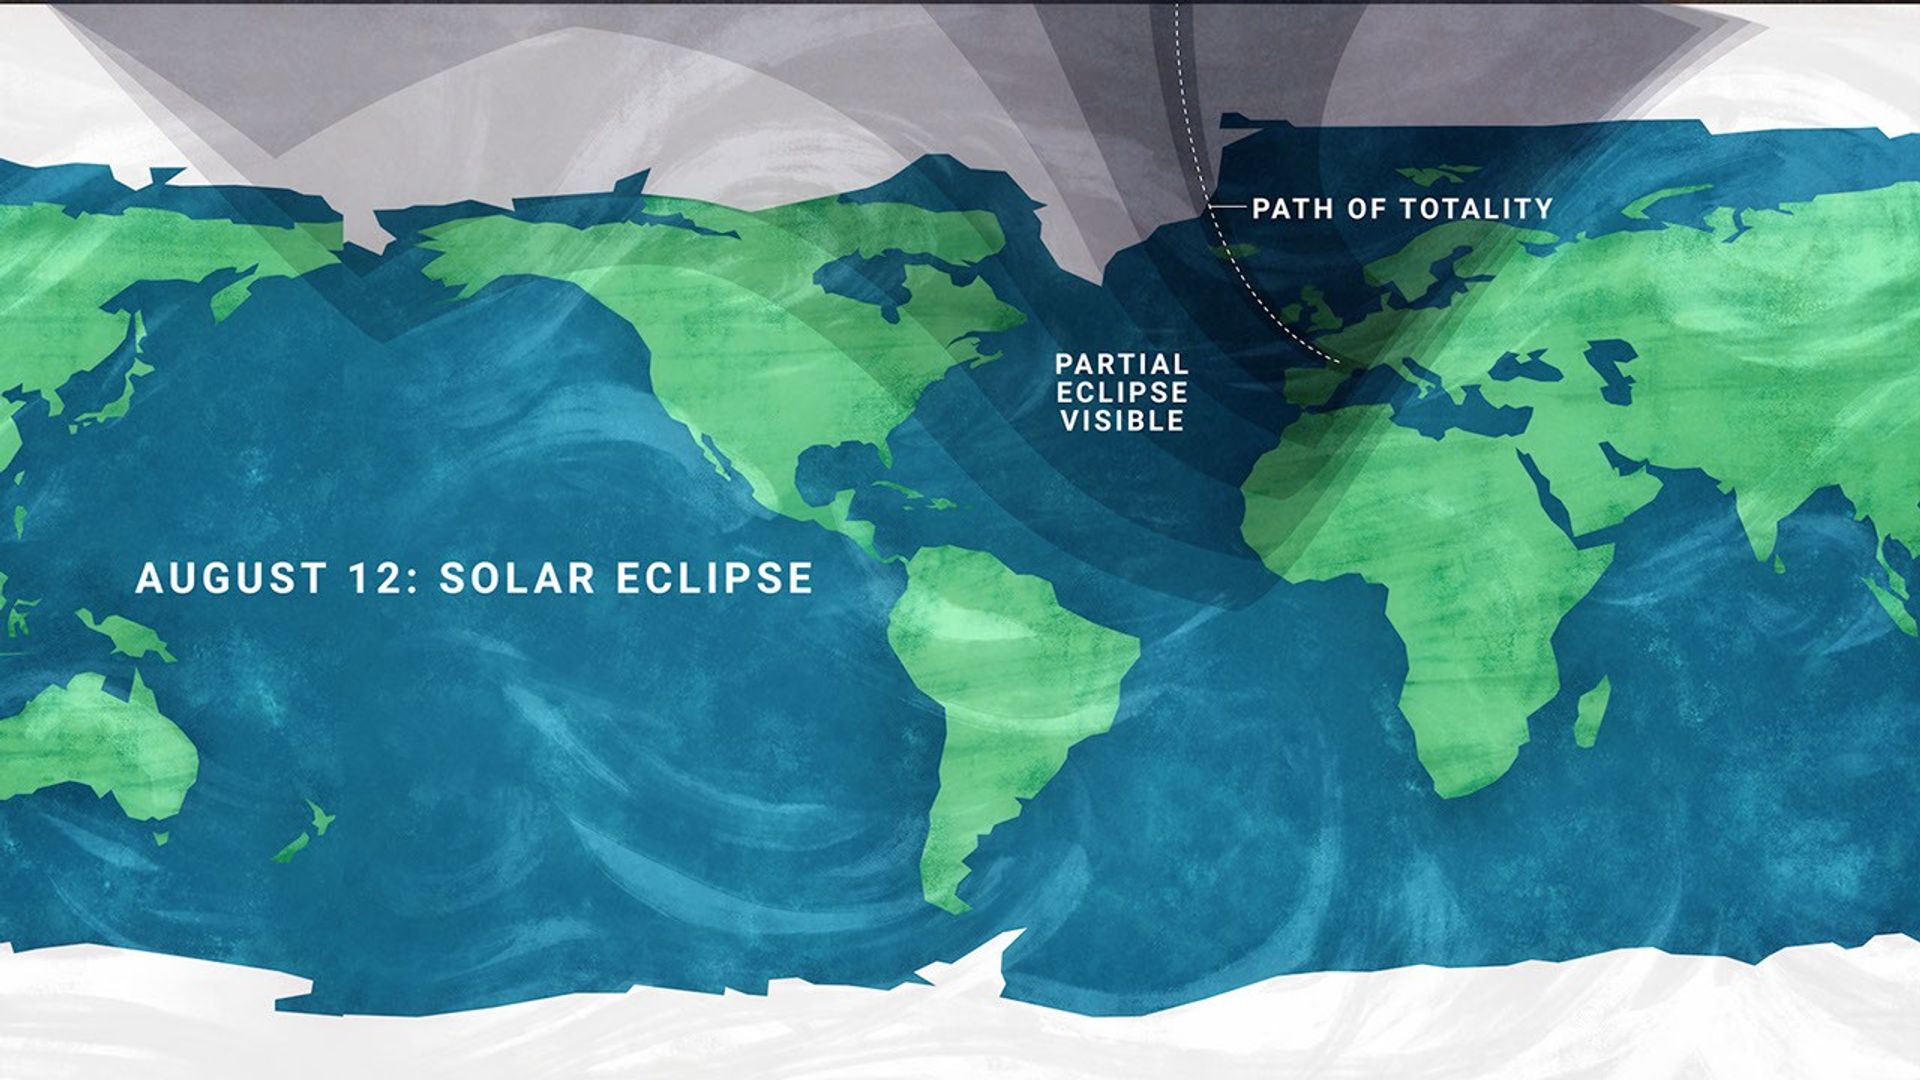
On Aug. 12, a total solar eclipse crosses northern Russia, Greenland, Iceland, and northern Spain, with a small corner of Portugal inside the path of totality.

In parts of the United States, from Alaska to North Carolina, the eclipse is partial. The Moon will take only a small bite out of the Sun, and the amount of coverage will vary with location.

A stylized flat map of the Earth indicating the viewing areas for a solar eclipse, with text on the left reading 'AUGUST 12: SOLAR ECLIPSE'. A semi-transparent dark shadow covers the northern portion of the globe, fanning out from the top edge. Within this shadow, a thin dotted line arcs down from the Arctic, crossing near Greenland and Iceland, passing over the Iberian Peninsula (Spain and Portugal), and ending near the Mediterranean Sea; this line is labeled 'PATH OF TOTALITY'. The broader shaded region surrounding this line is labeled 'PARTIAL ECLIPSE VISIBLE', and it covers northern North America, the Arctic, all of Europe, northern Africa, and northern and western Asia. The unshaded regions covering the rest of the map, including most of the United States, South America, central and southern Africa, and Australia, indicate areas where the eclipse will not be visible.
A map showing viewing areas of the August 2026 total solar eclipse.
NASA/JPL-Caltech

Remember to watch safely. Use certified eclipse glasses or a safe solar viewer any time any part of the Sun is visible. Regular sunglasses are not safe. And never use binoculars, a telescope, or a camera without a solar filter made for the front of the optics.

Later that same night, the Perseid meteor shower will light up the sky, peaking the evening of Aug. 12 into the early morning hours of the 13th. And with a New Moon arriving on the 12th, the skies will be ideally dark.

The Perseids happen every year when Earth passes through a debris stream left behind by Comet Swift-Tuttle. As those tiny bits of comet dust hit our atmosphere at high speed, they burn up as bright streaks of light.

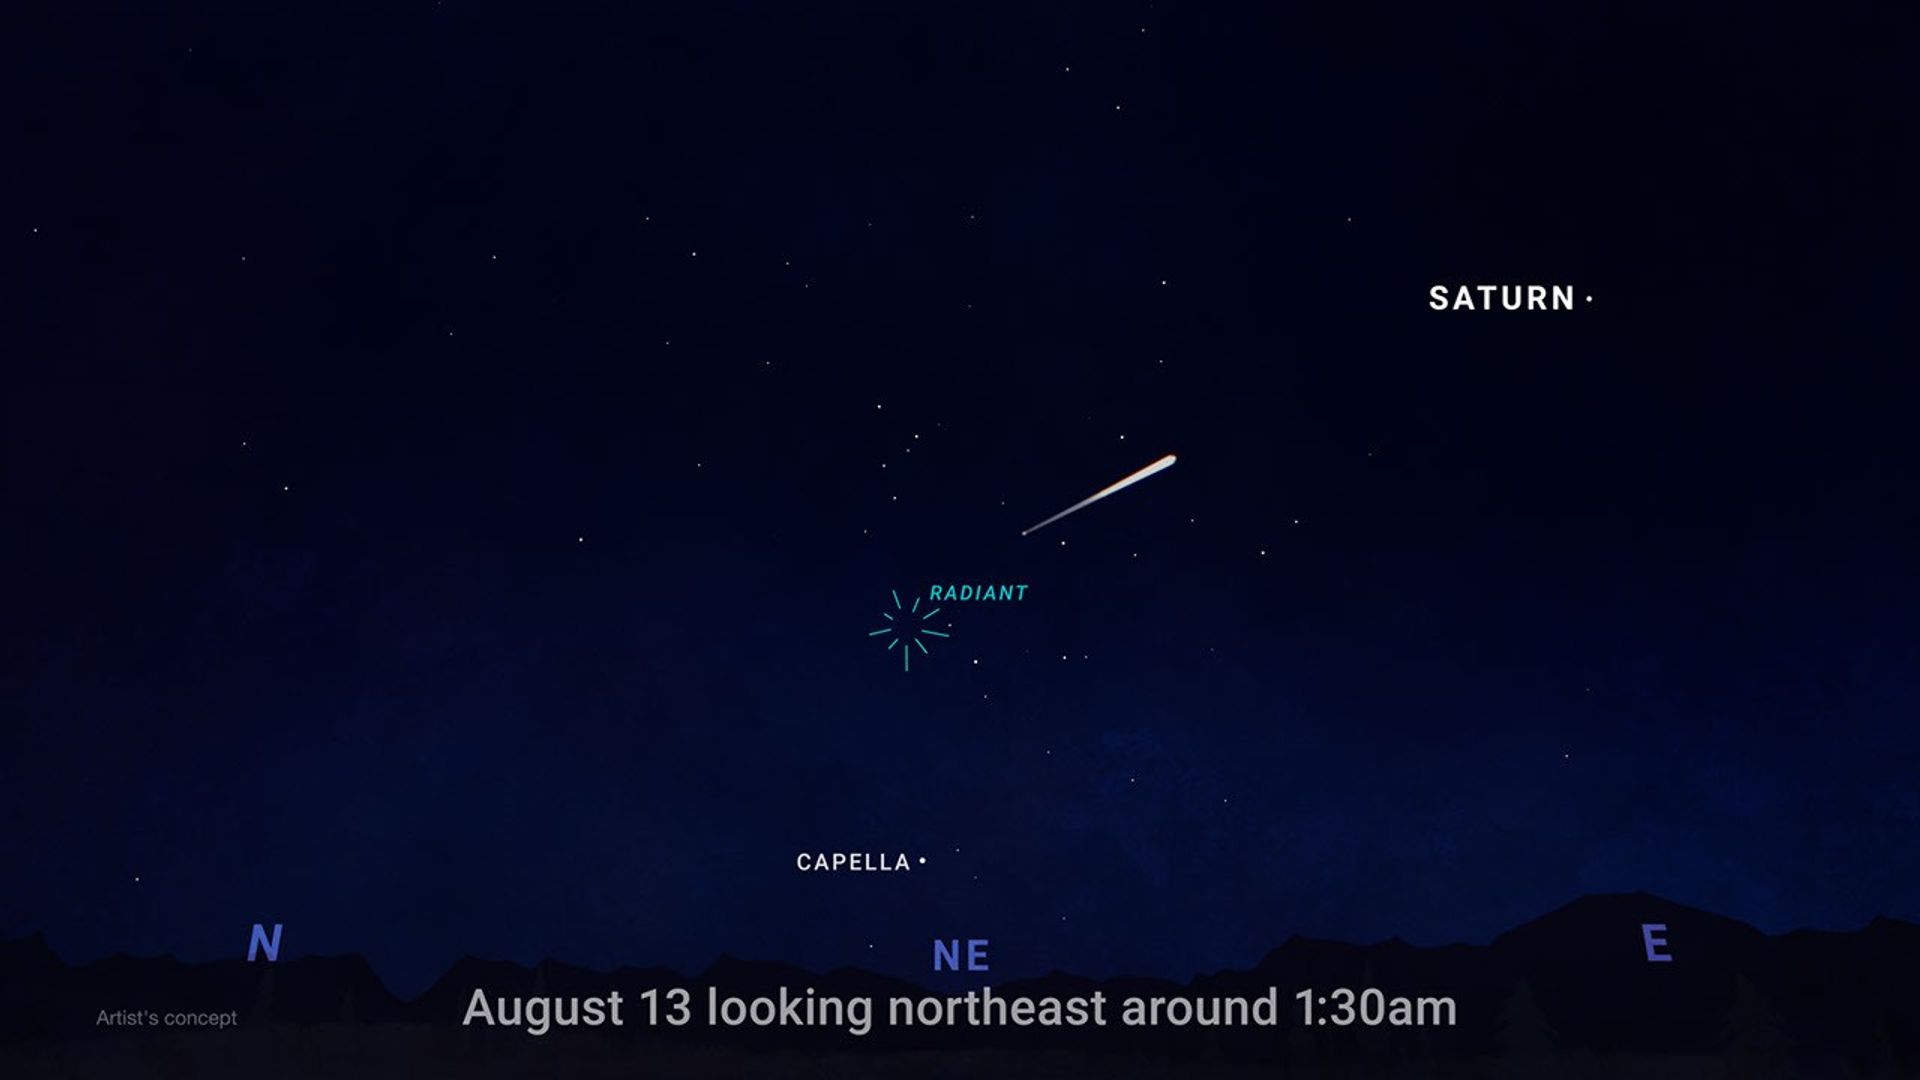
To view this meteor shower, look toward the northeast once it’s fully dark and watch for the constellation Perseus to clear the horizon. This is where the meteors originate, but let your eyes wander, because they can flash across any part of the sky.

For the best view, stay out late as the stars climb higher, find a dark open spot, and give your eyes 30 minutes to adjust.

An illustration of the night sky showing where to look for meteors, with text at the bottom reading 'August 13 looking northeast around 1:30am.' The bottom of the image shows a dark, silhouetted horizon of hills, marked with blue compass directions N (North), NE (Northeast), and E (East). In the center of the sky above NE is a teal burst icon labeled 'RADIANT,' indicating the point from which meteors appear to originate. A bright, white meteor streaks across the dark, starry sky, pointing back toward the radiant. Two other bright celestial objects are labeled: the star 'CAPELLA' is situated low in the sky below the radiant, and the planet 'SATURN' is positioned high up in the upper right corner. Small text in the bottom left corner reads 'Artist's concept.'
This illustration shows where in the night sky to look for the Perseid meteor shower.
NASA/JPL-Caltech

Aug. 14-16, Venus reaches its greatest eastern elongation, which is its widest apparent separation from the Sun during this evening appearance.

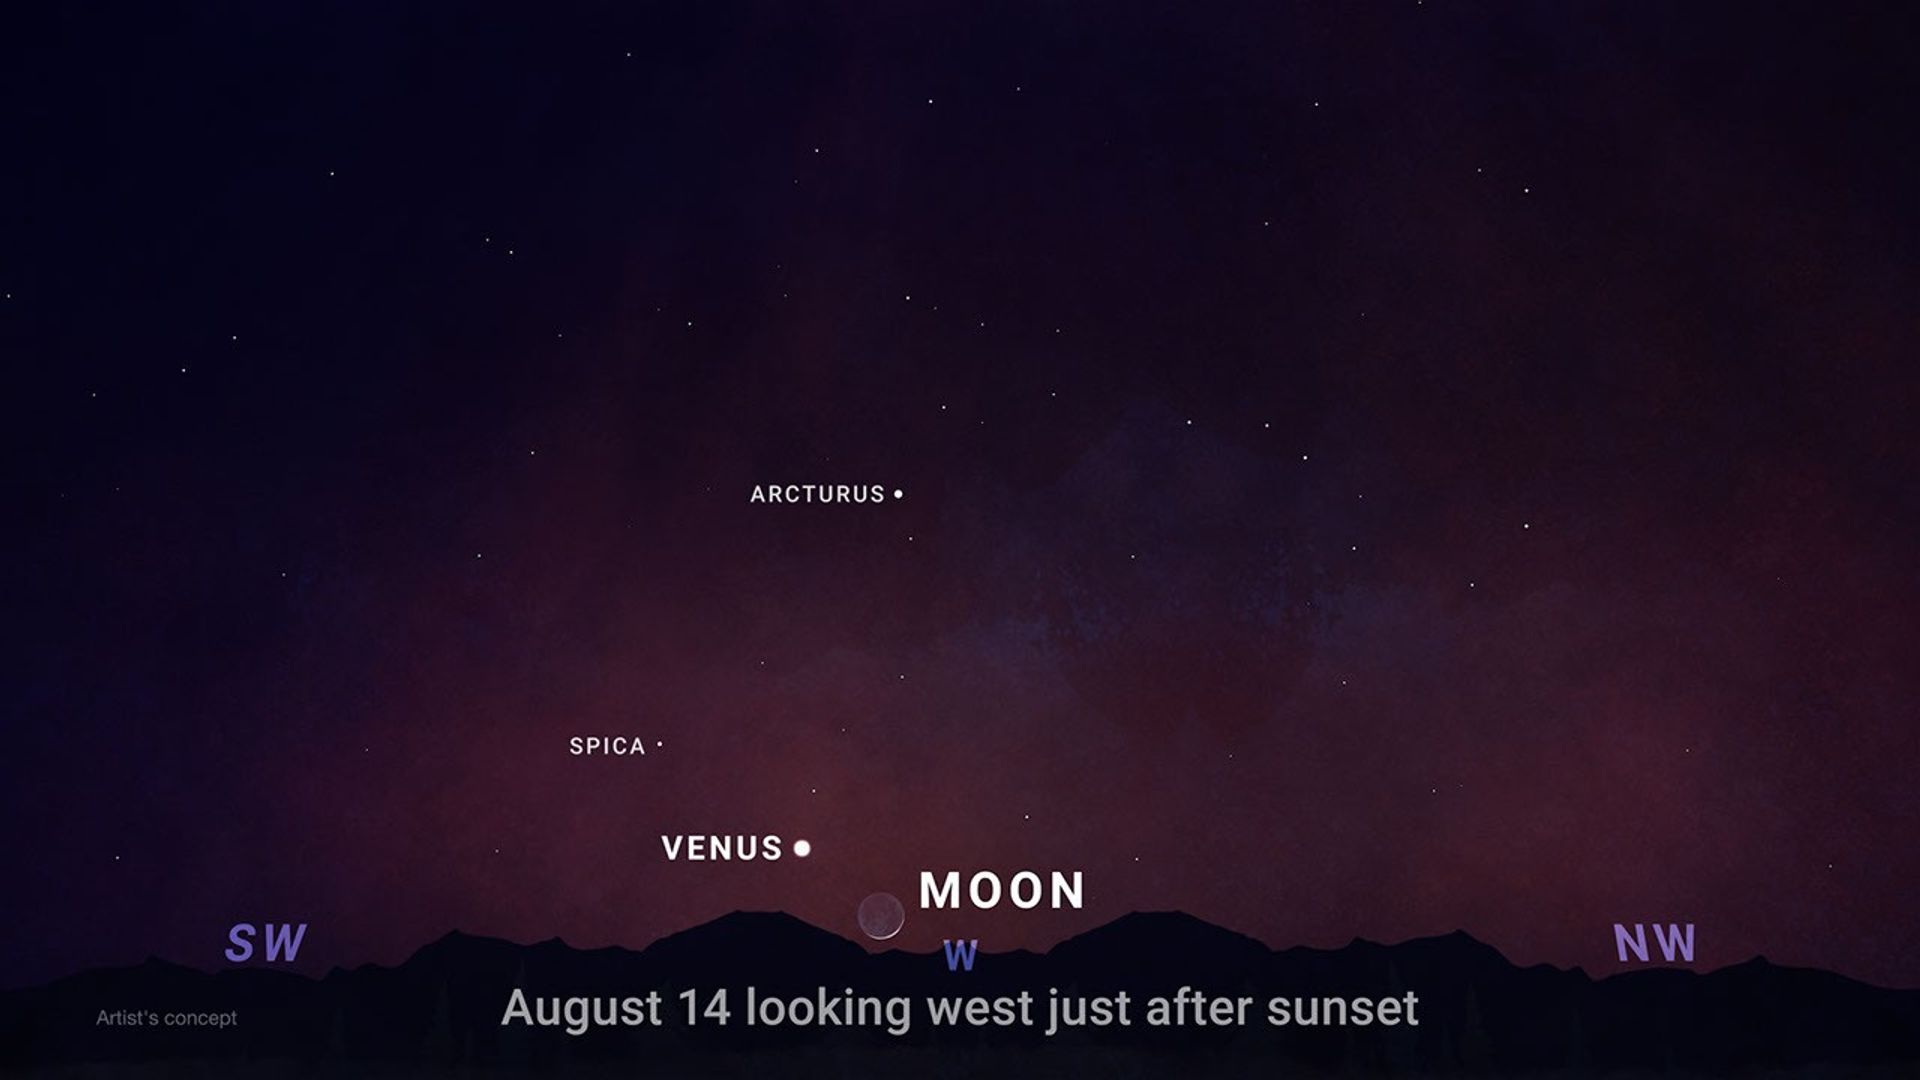
Look low in the western sky shortly after sunset for the bright object that will outshine every star around it. Through a telescope after sunset, Venus will look close to half lit, like a tiny lunar phase.

An illustration of the evening sky shortly after sunset, showing the positions of celestial objects. Text at the bottom center reads 'August 14 looking west just after sunset'. The bottom edge features a silhouetted, dark horizon of hills or mountains. Above the horizon, compass directions are indicated in purple: 'SW' (Southwest) on the left, 'W' (West) in the center, and 'NW' (Northwest) on the right. In the center, sitting very low on the horizon, is a faint crescent moon, labeled 'MOON'. Just to the left and slightly above the moon is a bright, white dot labeled 'VENUS'. Higher up and to the left of Venus is a smaller white dot labeled 'SPICA'. Above and to the right of Spica, towards the center of the image, is another labeled star, 'ARCTURUS'. The sky transitions from a deep reddish-purple near the horizon to dark blue at the top, sprinkled with numerous faint stars. In the bottom left corner, small text reads 'Artist's concept.'
This illustration shows where to observe Venus after sunset in August.
NASA/JPL-Caltech

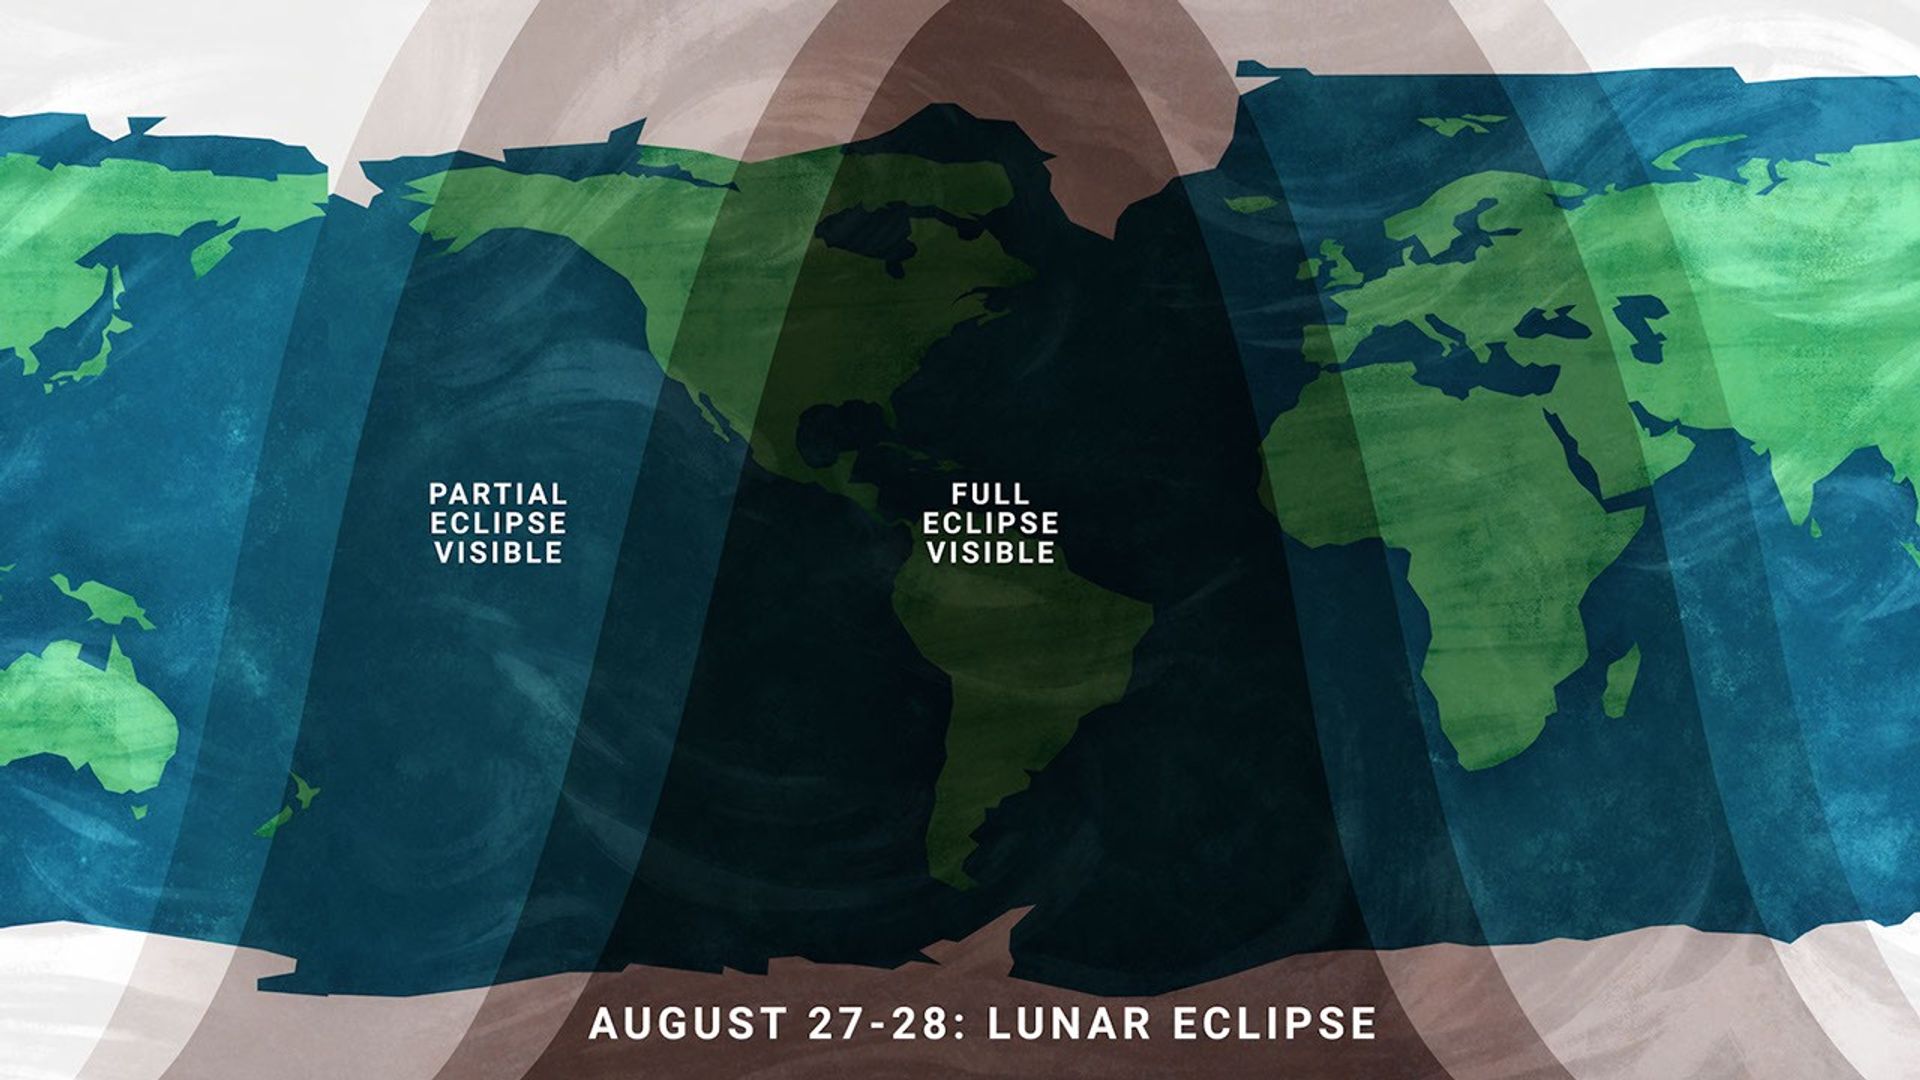
On the night of Aug. 27, continuing into Aug. 28 for some time zones, the Full Moon slips through Earth’s shadow, resulting in a partial lunar eclipse. It will be visible from much of North and South America and parts of Europe and Africa.

A stylized flat map of the Earth indicating the viewing areas for a lunar eclipse, with text at the bottom reading 'AUGUST 27-28: LUNAR ECLIPSE'. Large, semi-transparent dark bands arch across the map to represent visibility zones. The darkest central band, labeled 'FULL ECLIPSE VISIBLE', covers all of North America and South America, as well as the eastern Pacific Ocean and western Atlantic Ocean. Flanking this central region on the left and right are lighter shaded bands labeled 'PARTIAL ECLIPSE VISIBLE'. The western partial eclipse band covers the western Pacific Ocean and New Zealand, while the eastern partial eclipse band covers Europe and Africa. The unshaded outer regions of the map, including most of Asia and Australia, are areas where the eclipse will not be visible.
Viewing areas for the August 2026 lunar eclipse.
NASA/JPL-Caltech

At maximum eclipse, about 93% of the Moon’s diameter will be inside Earth’s dark central shadow, called the umbra. The Moon will not be completely covered, but it can look dramatically darkened, with a rusty, coppery tint along the covered edge.

Unlike a solar eclipse, a lunar eclipse is safe to watch with just your eyes. Binoculars or a small telescope can give you a closer view of Earth’s curved shadow moving across the Moon.

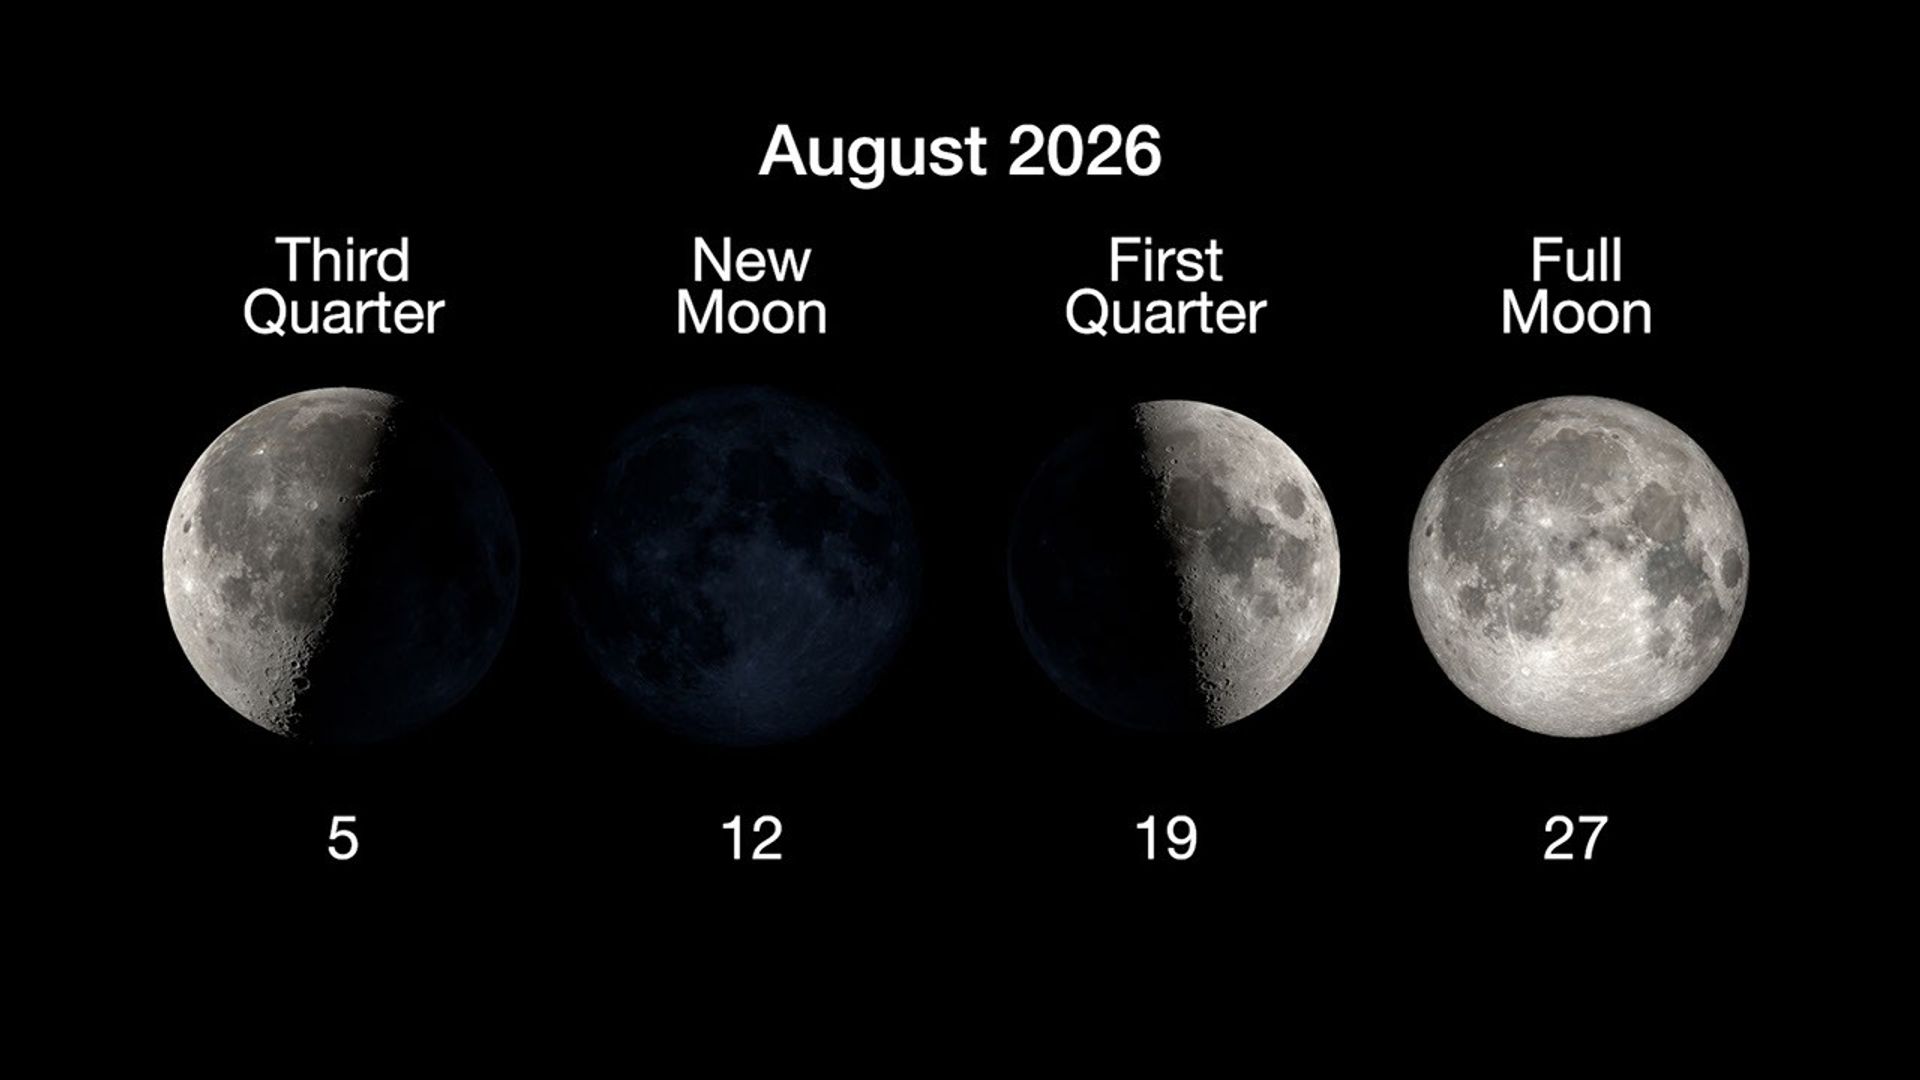
Here are the phases of the Moon for August.

An infographic on a black background titled 'August 2026' showing four primary phases of the Moon arranged in a horizontal row. Each phase features an image of the Moon with text above indicating the phase name and a number below indicating the date in August. From left to right:  'Third Quarter' on the 5th, showing the left half of the Moon illuminated. 'New Moon' on the 12th, showing the Moon's face completely in shadow. 'First Quarter' on the 19th, showing the right half of the Moon illuminated. 'Full Moon' on the 27th, showing the entire face of the Moon illuminated.
NASA/JPL-Caltech

You can stay up to date on all of NASA’s missions exploring the solar system and beyond at science.nasa.gov. I’m Raquel Villanueva from NASA’s Jet Propulsion Laboratory, and that’s What’s Up for this month.

Keep Exploring

Discover More Topics From NASA

The post What’s Up: August 2026 Skywatching Tips from NASA appeared first on NASA Science.

💾

A solar eclipse, one of the year's best meteor showers, Venus at its brightest in the evening sky, and a partial lunar eclipse to close out the month.On Augu...
  •  

What’s Up: August 2026 Skywatching Tips from NASA

A solar eclipse, the Perseids, bright Venus after sunset, and a deep partial lunar eclipse highlight August’s skywatching.

Skywatching Highlights

  • Aug. 5: Last Quarter Moon
  • Aug. 12: Total solar eclipse across northern Russia, Greenland, Iceland, northern Spain, and part of Portugal; partial eclipse in parts of the U.S.; New Moon
  • Aug. 12-13: Perseid meteor shower peak under dark skies
  • Aug. 14-16: Venus reaches greatest eastern elongation and shines low in the west after sunset
  • Aug. 27-28: Partial lunar eclipse visible from much of North and South America and parts of Europe and Africa

Transcript

A solar eclipse, one of the year’s best meteor showers, Venus at its brightest in the evening sky, and a lunar eclipse to close out the month.

That’s “What’s Up” for August.

On Aug. 12, a total solar eclipse crosses northern Russia, Greenland, Iceland, and northern Spain, with a small corner of Portugal inside the path of totality.

In parts of the United States, from Alaska to North Carolina, the eclipse is partial. The Moon will take only a small bite out of the Sun, and the amount of coverage will vary with location.

A stylized flat map of the Earth indicating the viewing areas for a solar eclipse, with text on the left reading 'AUGUST 12: SOLAR ECLIPSE'. A semi-transparent dark shadow covers the northern portion of the globe, fanning out from the top edge. Within this shadow, a thin dotted line arcs down from the Arctic, crossing near Greenland and Iceland, passing over the Iberian Peninsula (Spain and Portugal), and ending near the Mediterranean Sea; this line is labeled 'PATH OF TOTALITY'. The broader shaded region surrounding this line is labeled 'PARTIAL ECLIPSE VISIBLE', and it covers northern North America, the Arctic, all of Europe, northern Africa, and northern and western Asia. The unshaded regions covering the rest of the map, including most of the United States, South America, central and southern Africa, and Australia, indicate areas where the eclipse will not be visible.
A map showing viewing areas of the August 2026 total solar eclipse.
NASA/JPL-Caltech

Remember to watch safely. Use certified eclipse glasses or a safe solar viewer any time any part of the Sun is visible. Regular sunglasses are not safe. And never use binoculars, a telescope, or a camera without a solar filter made for the front of the optics.

Later that same night, the Perseid meteor shower will light up the sky, peaking the evening of Aug. 12 into the early morning hours of the 13th. And with a New Moon arriving on the 12th, the skies will be ideally dark.

The Perseids happen every year when Earth passes through a debris stream left behind by Comet Swift-Tuttle. As those tiny bits of comet dust hit our atmosphere at high speed, they burn up as bright streaks of light.

To view this meteor shower, look toward the northeast once it’s fully dark and watch for the constellation Perseus to clear the horizon. This is where the meteors originate, but let your eyes wander, because they can flash across any part of the sky.

For the best view, stay out late as the stars climb higher, find a dark open spot, and give your eyes 30 minutes to adjust.

An illustration of the night sky showing where to look for meteors, with text at the bottom reading 'August 13 looking northeast around 1:30am.' The bottom of the image shows a dark, silhouetted horizon of hills, marked with blue compass directions N (North), NE (Northeast), and E (East). In the center of the sky above NE is a teal burst icon labeled 'RADIANT,' indicating the point from which meteors appear to originate. A bright, white meteor streaks across the dark, starry sky, pointing back toward the radiant. Two other bright celestial objects are labeled: the star 'CAPELLA' is situated low in the sky below the radiant, and the planet 'SATURN' is positioned high up in the upper right corner. Small text in the bottom left corner reads 'Artist's concept.'
This illustration shows where in the night sky to look for the Perseid meteor shower.
NASA/JPL-Caltech

Aug. 14-16, Venus reaches its greatest eastern elongation, which is its widest apparent separation from the Sun during this evening appearance.

Look low in the western sky shortly after sunset for the bright object that will outshine every star around it. Through a telescope after sunset, Venus will look close to half lit, like a tiny lunar phase.

An illustration of the evening sky shortly after sunset, showing the positions of celestial objects. Text at the bottom center reads 'August 14 looking west just after sunset'. The bottom edge features a silhouetted, dark horizon of hills or mountains. Above the horizon, compass directions are indicated in purple: 'SW' (Southwest) on the left, 'W' (West) in the center, and 'NW' (Northwest) on the right. In the center, sitting very low on the horizon, is a faint crescent moon, labeled 'MOON'. Just to the left and slightly above the moon is a bright, white dot labeled 'VENUS'. Higher up and to the left of Venus is a smaller white dot labeled 'SPICA'. Above and to the right of Spica, towards the center of the image, is another labeled star, 'ARCTURUS'. The sky transitions from a deep reddish-purple near the horizon to dark blue at the top, sprinkled with numerous faint stars. In the bottom left corner, small text reads 'Artist's concept.'
This illustration shows where to observe Venus after sunset in August.
NASA/JPL-Caltech

On the night of Aug. 27, continuing into Aug. 28 for some time zones, the Full Moon slips through Earth’s shadow, resulting in a partial lunar eclipse. It will be visible from much of North and South America and parts of Europe and Africa.

A stylized flat map of the Earth indicating the viewing areas for a lunar eclipse, with text at the bottom reading 'AUGUST 27-28: LUNAR ECLIPSE'. Large, semi-transparent dark bands arch across the map to represent visibility zones. The darkest central band, labeled 'FULL ECLIPSE VISIBLE', covers all of North America and South America, as well as the eastern Pacific Ocean and western Atlantic Ocean. Flanking this central region on the left and right are lighter shaded bands labeled 'PARTIAL ECLIPSE VISIBLE'. The western partial eclipse band covers the western Pacific Ocean and New Zealand, while the eastern partial eclipse band covers Europe and Africa. The unshaded outer regions of the map, including most of Asia and Australia, are areas where the eclipse will not be visible.
Viewing areas for the August 2026 lunar eclipse.
NASA/JPL-Caltech

At maximum eclipse, about 93% of the Moon’s diameter will be inside Earth’s dark central shadow, called the umbra. The Moon will not be completely covered, but it can look dramatically darkened, with a rusty, coppery tint along the covered edge.

Unlike a solar eclipse, a lunar eclipse is safe to watch with just your eyes. Binoculars or a small telescope can give you a closer view of Earth’s curved shadow moving across the Moon.

Here are the phases of the Moon for August.

An infographic on a black background titled 'August 2026' showing four primary phases of the Moon arranged in a horizontal row. Each phase features an image of the Moon with text above indicating the phase name and a number below indicating the date in August. From left to right:  'Third Quarter' on the 5th, showing the left half of the Moon illuminated. 'New Moon' on the 12th, showing the Moon's face completely in shadow. 'First Quarter' on the 19th, showing the right half of the Moon illuminated. 'Full Moon' on the 27th, showing the entire face of the Moon illuminated.
NASA/JPL-Caltech

You can stay up to date on all of NASA’s missions exploring the solar system and beyond at science.nasa.gov. I’m Raquel Villanueva from NASA’s Jet Propulsion Laboratory, and that’s What’s Up for this month.

Keep Exploring

Discover More Topics From NASA

  •  

Spying on a Split Comet

240P

Traversing through the solar system, a comet split in two, and a recent study used six months of observations to investigate when and why.

A Split Comet

Orbit map

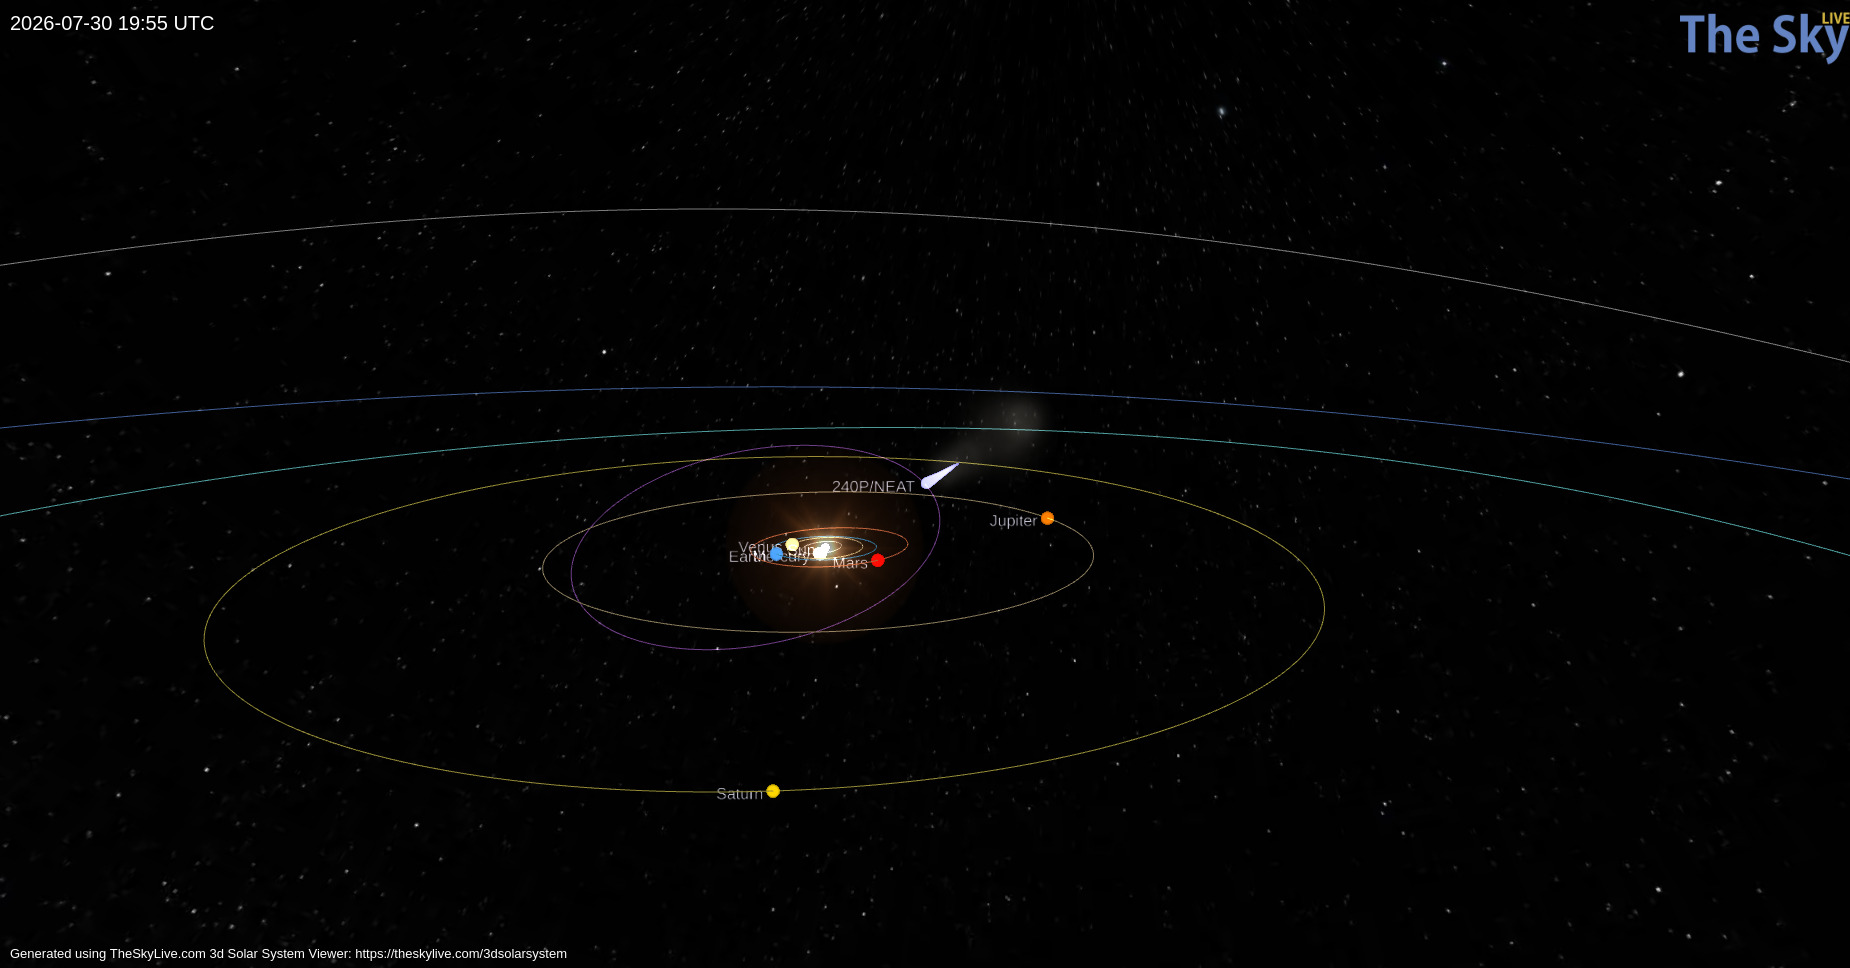
Orbital path of 240P/NEAT (purple) and the position of the comet on 30 July 2026 (light blue teardrop). Click to enlarge. [TheSkyLive]

While we often think of comets as icy remnants of the solar system’s formation that populate the Kuiper Belt and Oort Cloud, some comets make their homes closer to the Sun. One such class, known as Jupiter-family comets, traveled from the Kuiper Belt to short orbital periods (less than 20 years) whose paths through the solar system are shaped by Jupiter’s gravity. Discovered in 2002, 240P/NEAT is a Jupiter-family comet that loops between Jupiter and Mars on a 7.6-year orbit. Making close approaches to Jupiter, 240P experiences frequent, strong interactions with the gas giant that can alter the comet’s orbit and cause sudden bursts in brightness as ice and dust are heated and outgassed from the comet’s surface.

Most recently, 240P swept closest to Jupiter in July 2007, shifting the comet’s perihelion distance (closest approach to the Sun) from 2.5 to 2.1 au, and several long-lived bursts in brightness in 2018/2019 could have been spurred by this orbital shift. Excitingly, a fainter comoving object, 240P-B, was first reported in June 2025 as the comet headed toward perihelion — at some point recently, 240P had split in two!

Over the last century, numerous split comets have been recorded, but detailed physical studies of these objects are rare. With growing evidence suggesting splitting and disintegration are the primary mechanisms of comet destruction, understanding the properties and cause of 240P’s split is imperative.

Observing 240P

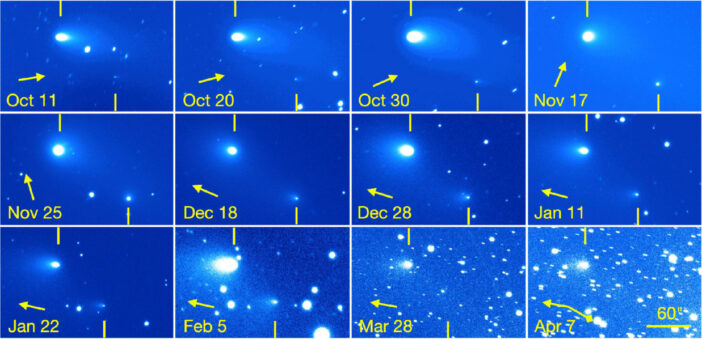
With 240P on the move to perihelion, David Jewitt (University of California, Los Angeles) and collaborators monitored the comet from October 2025 to April 2026 to establish the likely cause of its split. Employing the Alhambra Faint Object Spectrograph and Camera on the 2.56-meter Nordic Optical Telescope, the authors obtained detailed imaging of the comet from two months before to four months after perihelion to characterize both components.

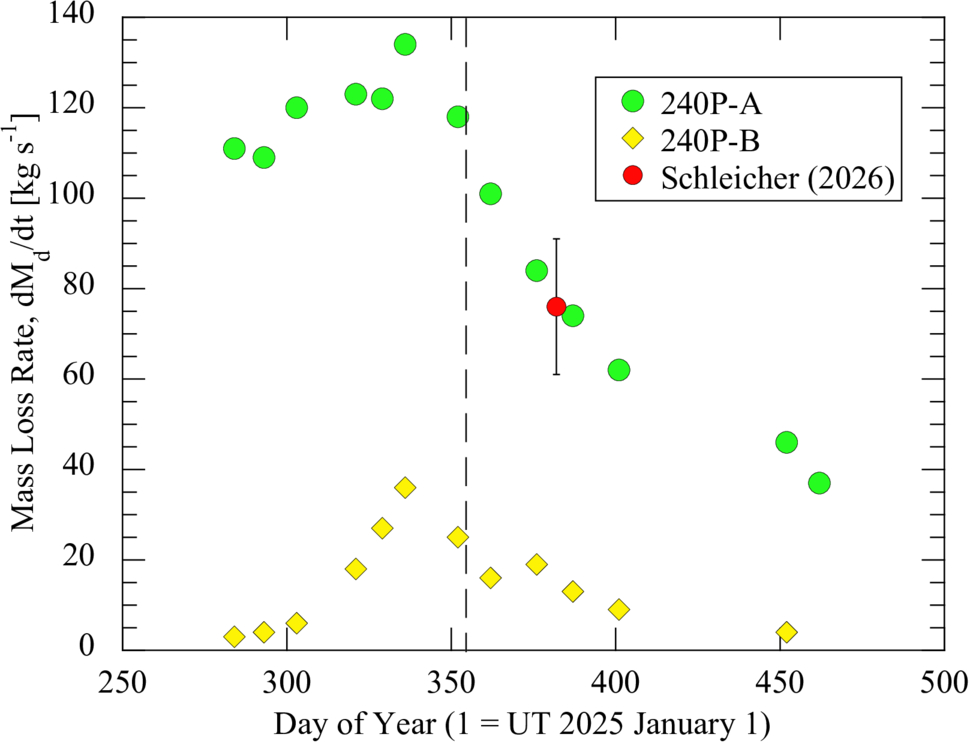
Tracking both photometric and morphological changes across their observations, the authors estimated the dust-loss rates, physical sizes, and separation speed of 240P-A and 240P-B. The brighter component, 240P-A, has an estimated radius between 400 and 600 meters and a dust-loss rate almost four times higher than 240P-B. Because 240P-B is fainter, its radius is harder to constrain observationally. From its lower dust-loss rate and lower brightness, the authors estimated a radius around 300 meters (and no smaller than 50). Based on how the separation of the two comet pieces changes over time, the authors determined that the split of 240P occurred at least three years before their observations.

dust mass-loss

Dust mass-loss rates for 240P-A (green circles) and 240P-B (yellow diamonds) over the course of the observations. Both components peak shortly before perihelion (dashed vertical line). Click to enlarge. [Jewitt et al 2026]

Source of the Split

How exactly did this fragmented comet get this way? The authors considered a number of comet-splitting mechanisms: tidal forces, asteroid impact, pressure buildup below the comet’s surface, thermal stresses, and rotational instability. Given the comet’s orbit, it has not had close enough encounters with the Sun or other planets for tidal forces to be the culprit, and it traverses well above the asteroid belt, avoiding collisions. Pressure buildup and thermal stresses can fracture comets, but both are unlikely to launch such a large fragment as seen in this system.

This leaves rotational instability as the likely source of 240P’s split. Outgassing torques lead to rotational instability, especially in subkilometer comets like 240P, and 240P has exhibited recent outgassing. In addition, the separation speed between the 240P components is comparable to the escape speed of the primary comet, which is expected for rotational breakup. To confirm this hypothesis, future observations measuring the rotation period of 240P are necessary, but this study adds to the small number of split-comet observations that aid in understanding comet destruction.

Citation

“Investigation of Split Comet 240P/NEAT,” David Jewitt et al AJ 172 113. doi:10.3847/1538-3881/ae83ac

The post Spying on a Split Comet appeared first on AAS Nova.

  •  

Pathogenic review: Damn, it feels good to be a virus

Over the past couple of weeks, my immune system has been struggling to fight off a cold. It’s been unpleasant, as all colds are. But throughout this time—in defiance of my plight—I’ve been waging my own war against immune systems, thanks to Pathogenic, a new roguelite twin-stick shooter from developer Aberrant Labs.

As I've downed endless shots of ineffective cough syrup, I’ve done little else with my free time than repeatedly take on the role of a bodily invader. And let me tell you: Being on the enemy’s side is much more fun. Really fun, as it turns out.

Action roguelites are a dime a dozen these days, and it takes something special to stand out. So as quiet Internet whispers turned into widespread cacophonous praise—the little indie game quickly racked up 100,000 sales and an “overwhelmingly positive” review score on Steam—I set aside my default skepticism and gave it a shot.

Read full article

Comments

© Aberrant Labs/Slug Disco

  •  

1st three-headed asteroid found in our solar system — and it has a little moon

Scientists have found the first triple-lobed asteroid in the asteroid belt between Mars and Jupiter — and it has a small moon to boot.

The asteroid in question is 44 Nysa, which was discovered all the way back in 1857. Of course, back then it was just a pinprick of light in the sky, and subsequent observations — including some from the Hubble Space Telescope — had failed to tell us much about Nysa. Those previous observations suggested Nysa might be bi-lobed, like many asteroids and comets such as asteroid 52246 Donaldjohanson, which NASA's Lucy mission flew past in 2025.

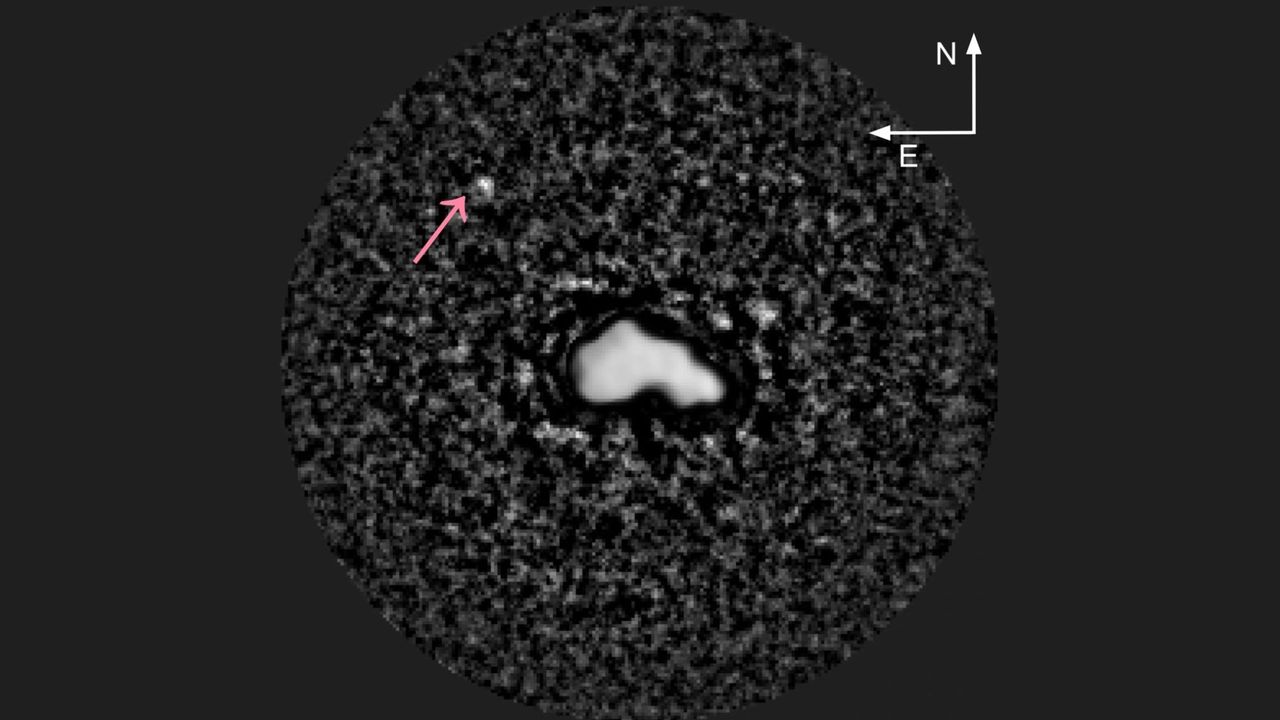
However, new joint observations by the Large Binocular Telescope (LBT) on Mount Graham in Arizona and the Very Large Telescope (VT) on Paranal mountain in Chile have revealed that this asteroid actually seems to have three lobes, the first such object ever seen.

"The images reveal a remarkably unusual object," said lead researcher Kate Minker of Arizona's Lowell Observatory in a statement. "The most likely explanation is that Nysa is either a contact trinary, consisting of three connected components, or an extremely irregular coherent body unlike anything we've previously observed."

Obtaining the detailed images of Nysa was not easy. Key to the success were two high contrast imaging devices, the Italian-built SHARK-VIS on the LBT and SPHERE and its ZIMPOL polarimeter on the VLT, used in conjunction with adaptive optics that counteract the blurring effect of the atmosphere.

"These observations had to be combined with specially developed image-processing techniques to further sharpen the images and remove the bright halo surrounding the asteroid, potentially hiding faint companions," said Anthony Berdeu of the European Southern Observatory.

The images showed an irregular-shaped body 47 miles (75 kilometers) at its widest point, with two notable valleys or "colli" that wrap around the asteroid's circumference and which Minker's team interprets as being the necks of the different lobes. Furthermore, the images revealed a 0.6-mile-wide (1-km-wide) moon orbiting Nysa at a distance of at least 106 miles (170 km). The moon has been designated S/2026 (44) 1 for now. And, because it was seen independently during two different observing campaigns, it was possible to observe its motion around Nysa.

The white blob rotates. There is a small white dot that moves along with it.

An animation showing the rotation of Nysa and its orbiting moon. (Image credit: Kate Minker et al.)

"We borrowed a specialized technique from another field of astronomy, known as high-contrast imaging, to detect the small moon whose faint light was overwhelmed by the intense brightness of the primary asteroid," said Gianluca Li Causi of the SHARK-VIS team at the Italian National Institute for Astrophysics (INAF).

Nysa is named after the mythical land where the ancient Greek god Dionysus was raised by nymphs. Al Conrad of the Large Binocular Telescope Observatory finds the name fitting because Dionysus was the Greek god of theater, which for the ancient Greeks often involved wearing masks and hiding one's true identity.

"We're finally unmasking the asteroid's true nature, long after it was discovered," said Conrad.

How such a bizarre object formed remains uncertain, but Minker's team does have a couple of ideas.

The team's preferred explanation is that Nysa is a contact trinary — three asteroid bodies being held together loosely by gravity. The best alternative, the researchers say, is that Nysa once upon a time had a close encounter with a much larger asteroid that slammed into it, thereby deforming it. In these situations, modeling suggests that gravitational tidal forces could have deformed Nysa's mantle, creating Nysa's odd shape and even ripping it apart into a bunch of fragments in a string-of-peals configuration. If this is the case, then where did the other fragments go? Such events usually produce a family of asteroids all sharing the same composition, but Nysa seems to be alone (barring its moon, of course).

There could be a way to distinguish between the two possible origins. By tracking the moon's orbital velocity and period, astronomers will be able to pin down the exact mass and density of Nysa and then see which model matches it best.

Nysa has been a subject of study because it can also tell us about the birth of our own planet Earth. Nysa is more reflective than many other asteroids thanks to its surface composition that is abundant in a silicate mineral called enstatite, which lacks iron. Asteroids like this are generally called E-types, and Nysa is the largest and brightest of all of them. E-type asteroids are thought to have formed close to the sun and therefore have been identified as potential building blocks of the inner planets. If Nysa is a relic of that time, it could tell us a great deal about conditions in the inner solar system 4.5 billion years ago.

The findings can be read on the arXiv archive, and have been submitted to the journal Astronomy & Astrophysics.

  •  

Satellites spy penguin poop on Danger Islands | Space photo of the day for July 30, 2026

a satellite view of two long islands

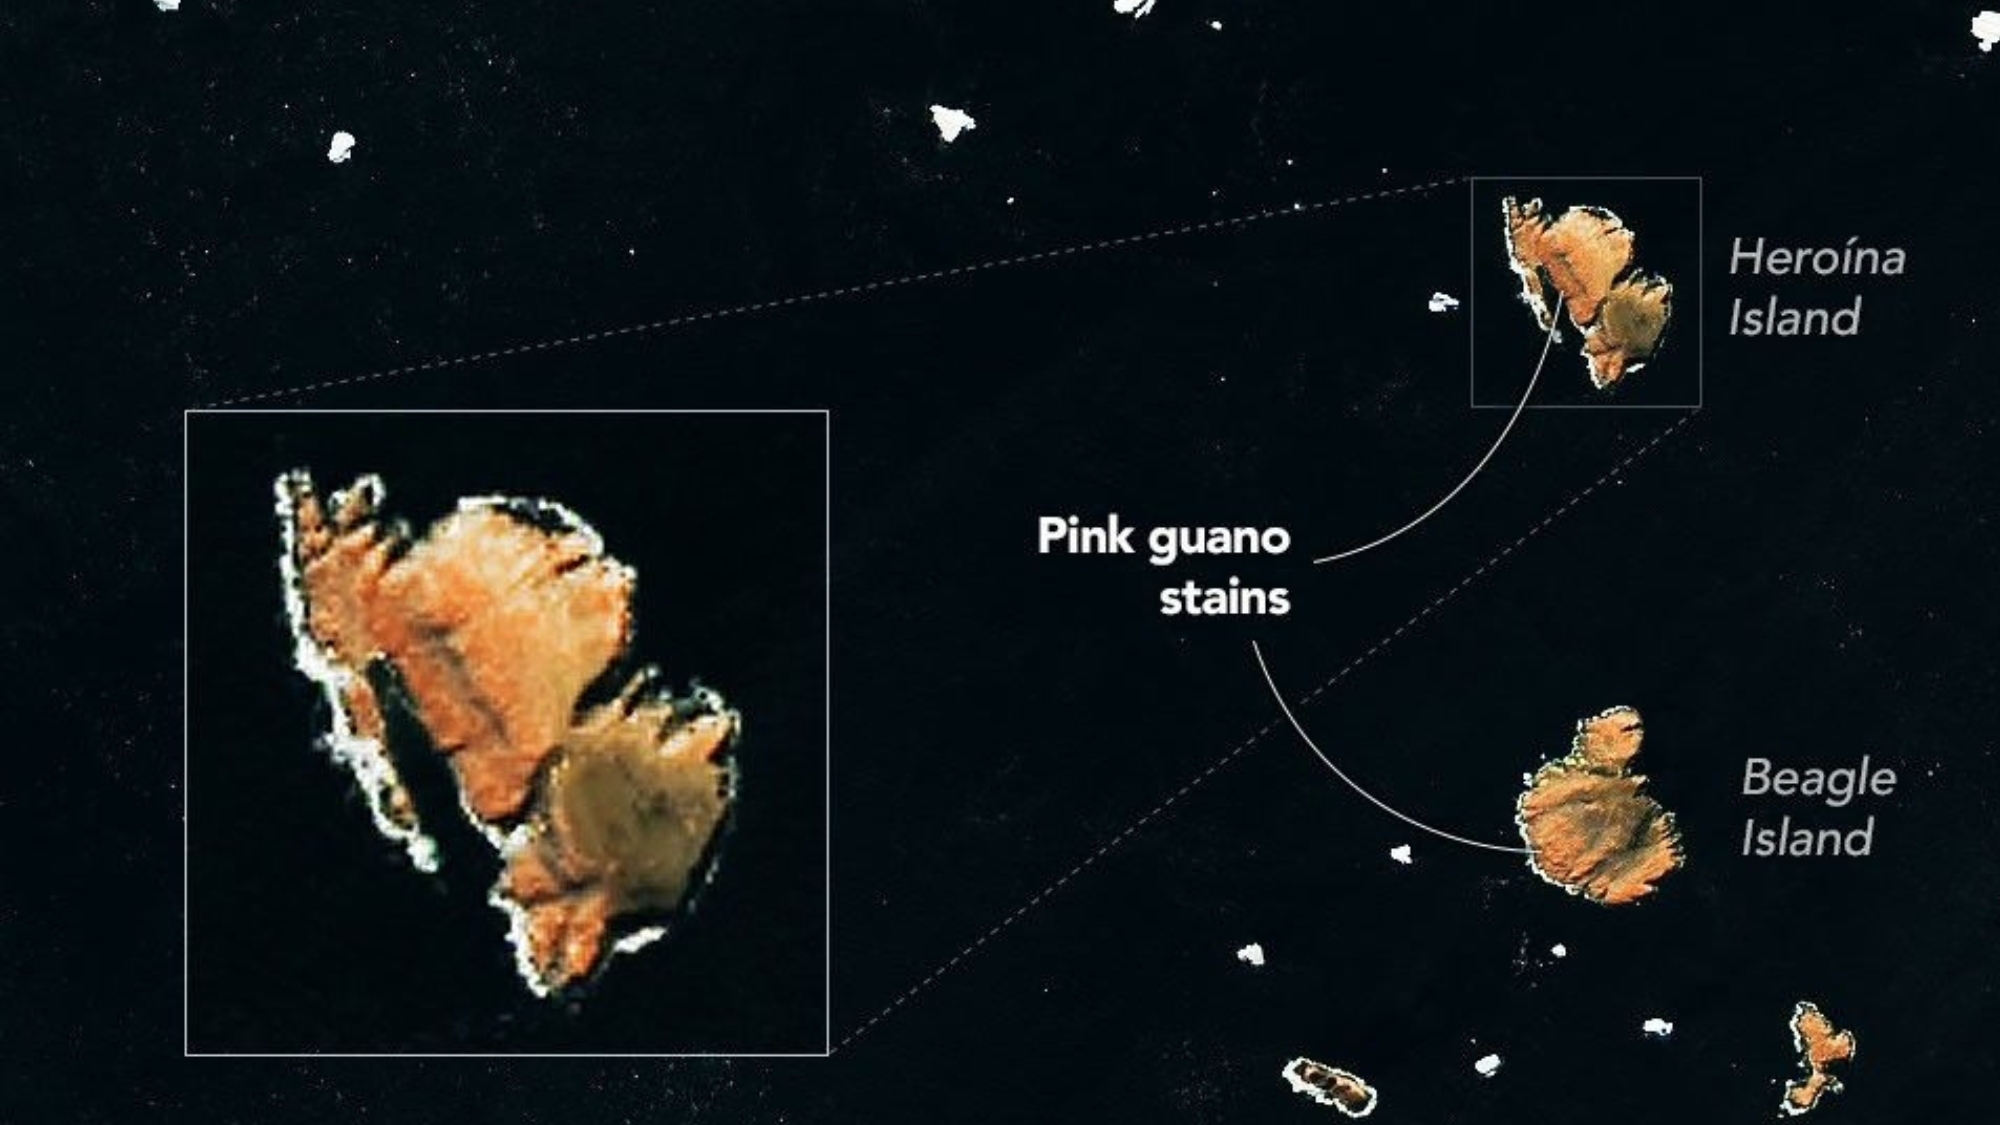
Pieces of sea ice drift near Antarctica's Danger Islands in this image, acquired on Jan. 22, 2023, by the Landsat 8 satellite. Several of the islands are stained pink by guano from Adélie penguins with a krill-rich diet. (Image credit: NASA Earth Observatory/Michala Garrison)

The diets of penguins on Antarctica's Danger Islands can be seen from space. At least indirectly.

Using satellite images captured by the Landsat 8 spacecraft operated by NASA and the United States Geological Survey, scientists can track changes in Adélie penguins' diets based on the color of their guano, or droppings.

What is it?

The image above shows pinkish-orange guano staining large sections of some of the Danger Islands, Heroína Island and Beagle Island. The penguins that live there eat a diet rich in krill, small marine crustaceans that are bright pink in color due to a specific type of algae upon which they feed.

a group of penguins jump from one ice floe to another in the sea

A group of Adelie penguins jumping from ice pebble to ice pebble on a beach of Paulet Island on the tip of the Antarctic Peninsula. (Image credit: Wolfgang Kaehler/LightRocket via Getty Images)

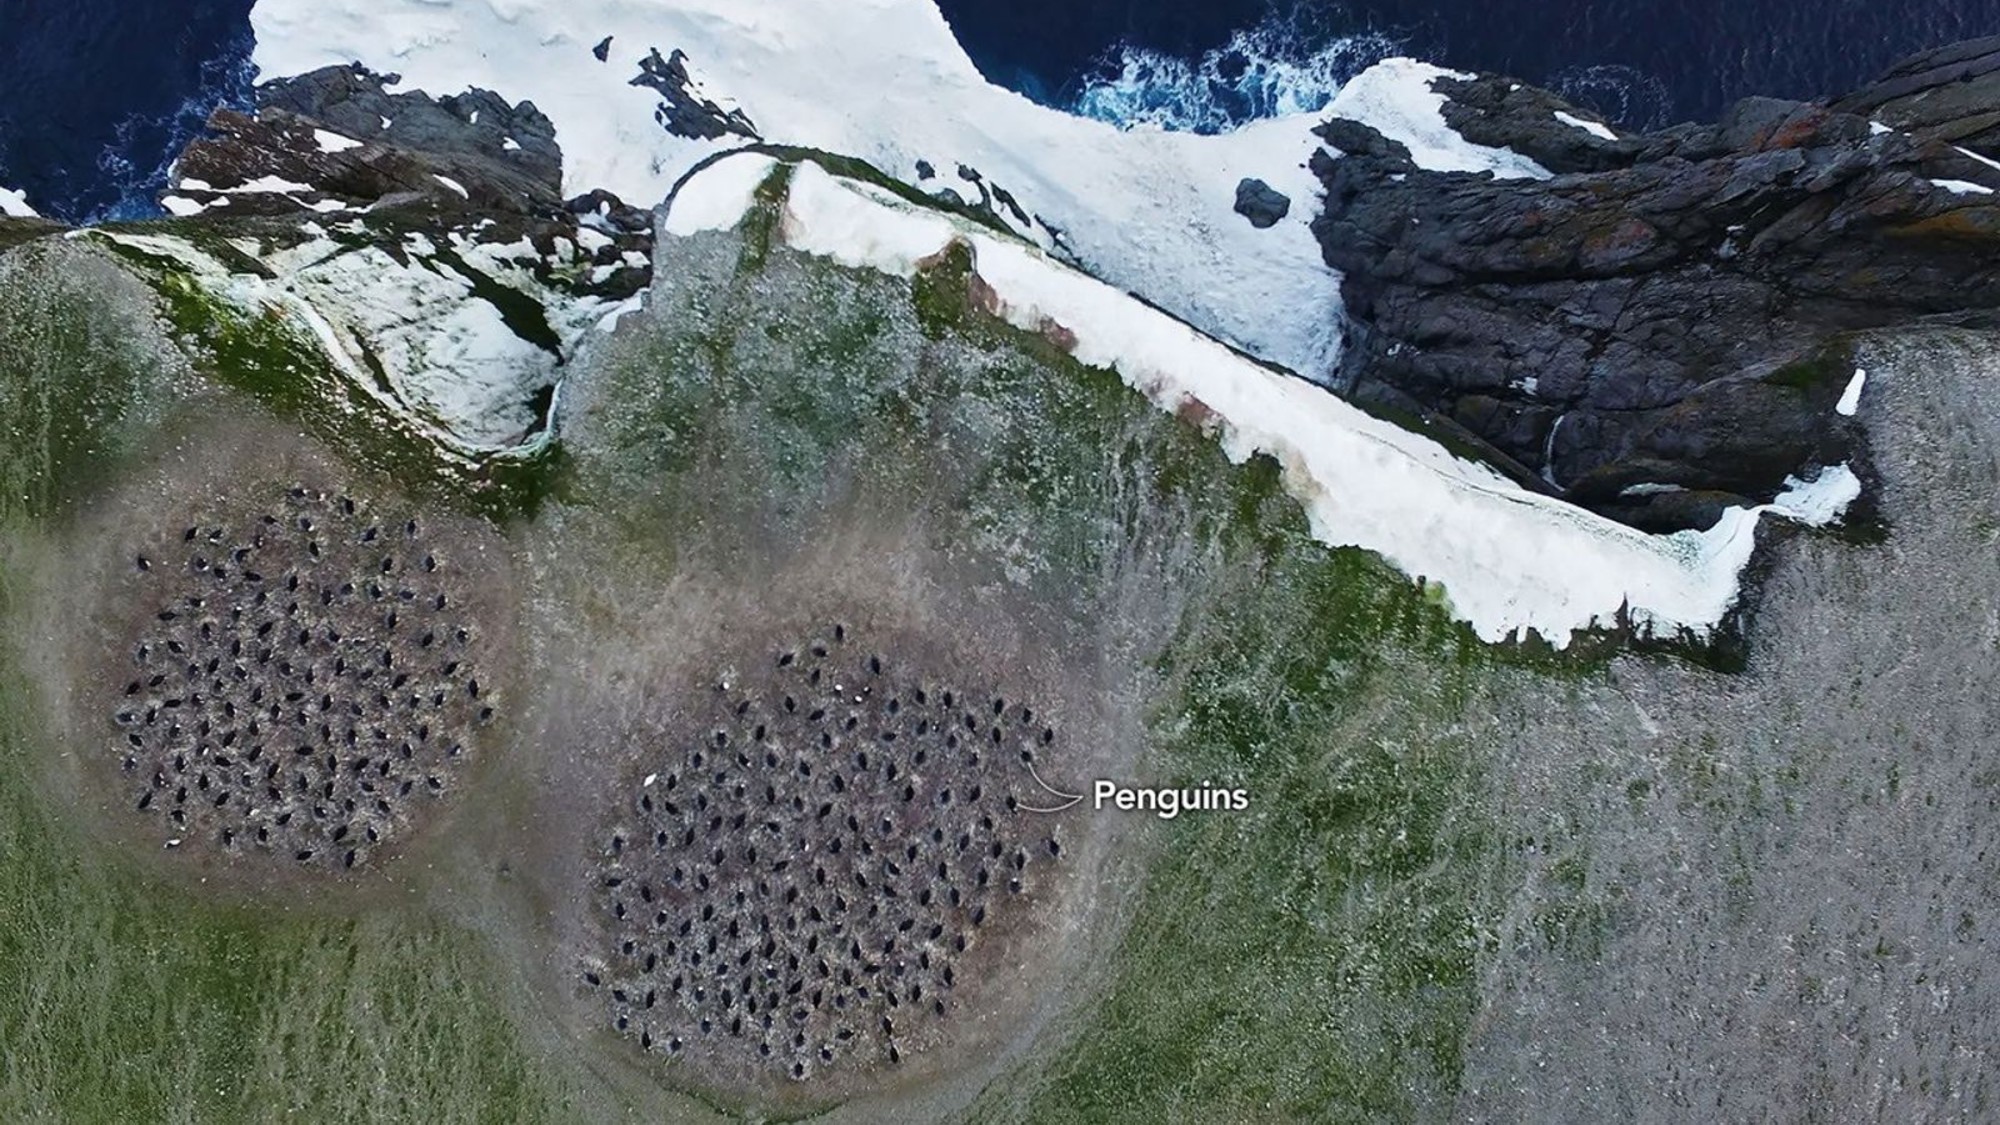
The bright pink color of the penguins' droppings stands out in satellite imagery, allowing researchers to monitor the birds' populations from space. But scientists wanted a closer look, and collected drone imagery as well, as seen in the image below.

two large clumps of dots can be seen on a grassy hill lined with snow and ice from an overhead perspective

A colony of Adélie penguins is visible in this image captured by a drone during a research expedition to the Danger Islands. (Image credit: Thomas Sayre-McCord/WHOI/MIT)

Why is it incredible?

It's pretty amazing that the diet of a specific population of birds can be monitored from 438 miles (705 kilometers) above Earth's surface. The imagery collected by Landsat-8 helped scientists locate where the penguin colonies might be, allowing them to find them in-person and collect guano samples. Those samples contained evidence of what the penguins were eating over time.

Researchers are using those satellite images and samples to track how the penguins' diet might be affected by changes in sea ice conditions, according to a NASA statement.

"Sea ice is such a hugely important factor in the Antarctic marine environment," said Clemson University biologist Casey Youngflesh who led a study comparing the penguins' diet and sea ice conditions. "The structure of the region's food web is changing in response."

  •  

A SpaceX rocket will crash into the moon next week, and scientists aren't sure what to expect

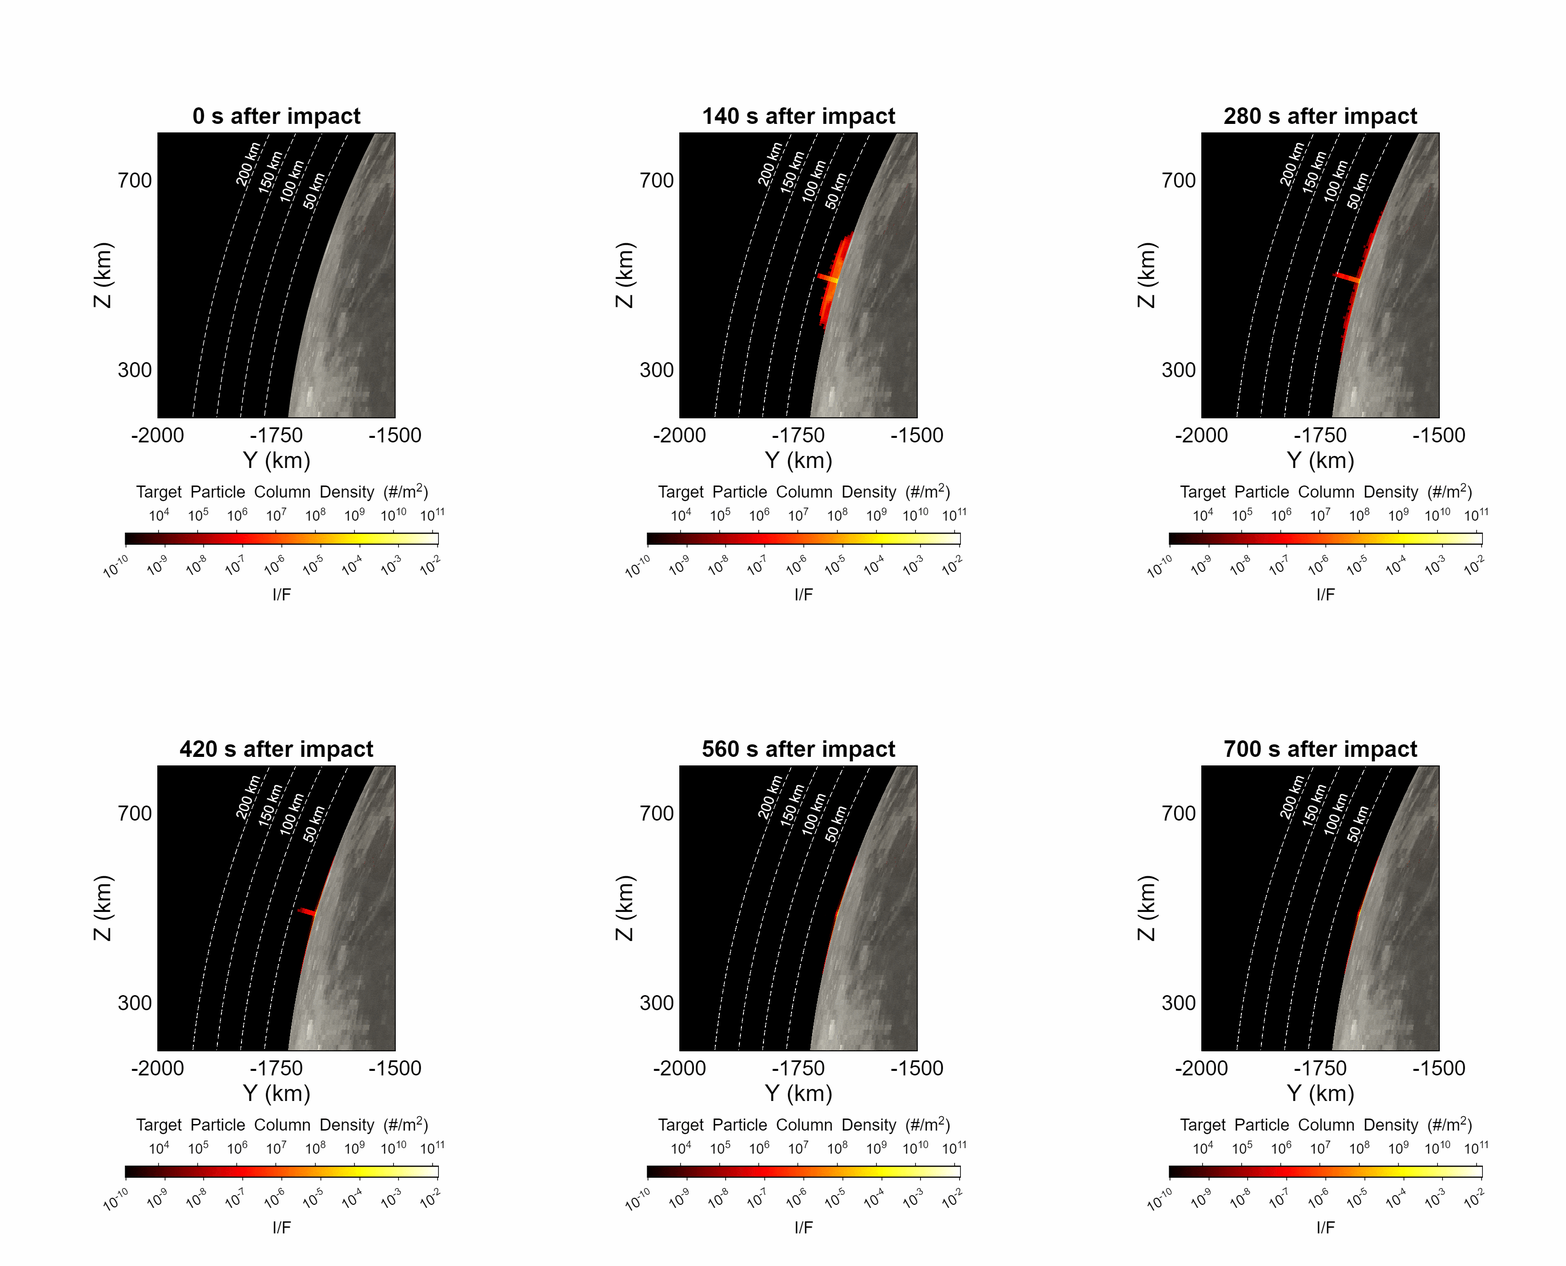
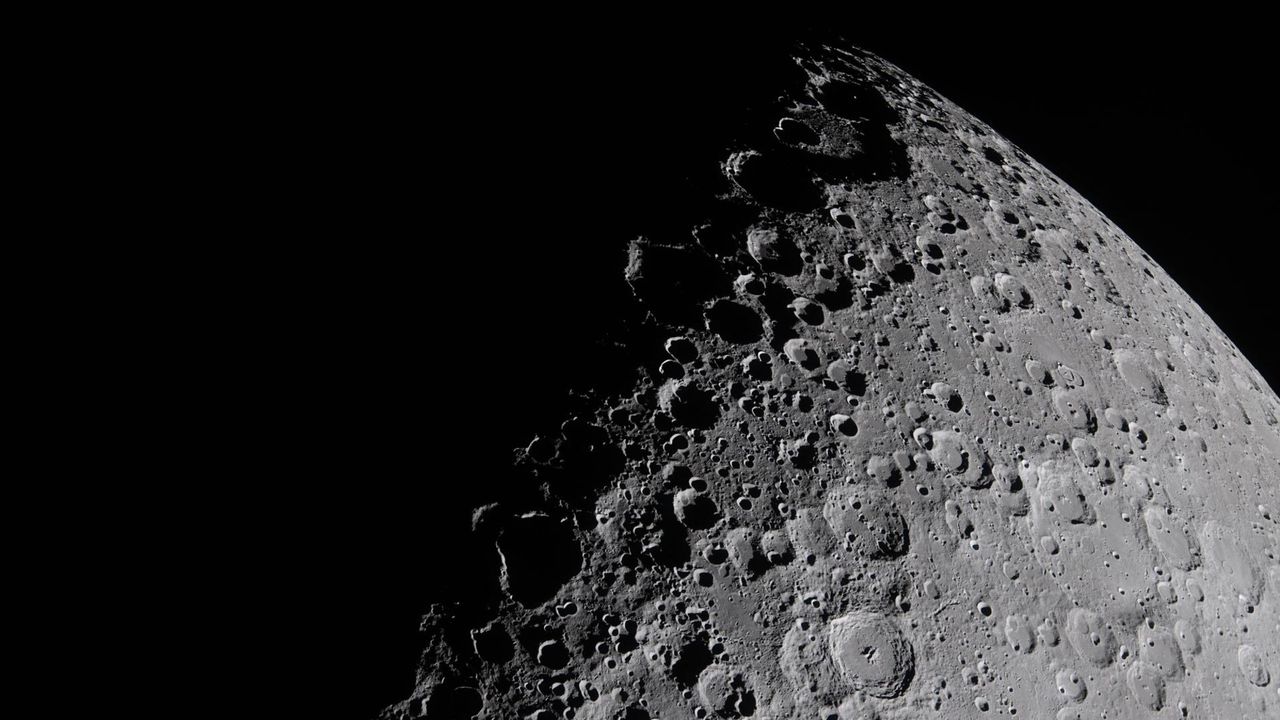
On Aug. 5, Earth's moon is due for a human-made, high-speed impact from an identified flying object: a spent SpaceX Falcon 9 upper stage. The event will lead to a literal "dust up" on the lunar landscape.

That Falcon 9 upper stage is a leftover from the launch that sent Firefly's Blue Ghost-1 lander to the moon on Jan. 15, 2025. Onboard the same flight was the Hakuto-R Mission 2, called Resilience, a robotic lunar lander developed by the Japanese company ispace.

And according to a new study by an international team published on the open-source arXiv server, the resulting impact plume may briefly be bright enough to see against the dark sky near the moon's edge. That means it might be visible to moongazers with sufficiently sensitive telescopes.

This head-on collision of the errant stage is expected to occur near the Einstein and Bell craters near the western lunar limb. It may well be visible to ground and space-based assets. Indeed, putting aside all the unknowns and modeling uncertainties, some specialists suggest if you've got the time and observational prowess, it might be worth a look.

Visible ejecta spike

Using special physics simulations to model the impact, William Jo, a graduate research assistant at the University of Texas, Austin and colleagues predict the debris plume from the impact will have the central ejecta spike reaching roughly 47 miles to over 60 miles (75 kilometers to 100 kilometers) altitude.

"Our calculations suggest the plume should be several orders of magnitude brighter than the dark-sky background for the first few minutes after impact," Jo told Space.com. "So the plume should be visible, though I'd stress this is a single nominal case. The real one will look different, and the numbers are on the optimistic side. But the point worth making is that the flash isn't really the story here."

Jo emphasized that there's great slam-dunk science to be had. "Watching this one gives us a rare chance to open up ejecta-plume science and calibrate those models against a real event, which matters for every future thing we deliver to the moon," Jo said.

an animation showing a red plume expanding upward from a mottled grey surface

An animation predicting the evolution of the target ejecta column density, rendered on the lunar surface at the predicted impact site near Einstein crater by William Jo et al. (Image credit: William Jo/UT Austin)

Implications for future moon missions

According to new research led by Benjamin Fernando of the Los Alamos National Laboratory in New Mexico, the impact flash and resultant ejecta plume are "potentially observable" from ground- and space-based observational facilities.

"This event provides an opportunity to attempt the recording of an artificial impact in real-time; although many of the properties of the event (such as visual magnitude) are imprecisely predicted at present," Fernando and colleagues report.

Moreover, this rocket stage meets moon occasion yields an opportunity to test a pipeline for localizing impacts on the lunar surface for future seismic experiments, investigating the dust and plume dynamics from impact events on the moon, and considering hazards from artificial space debris impacts that future astronauts on the lunar surface might have to avoid, Fernando and team members point out.

"The maximum ballistic range of resolved particles is found to be slightly under 1,000 km, which is far enough to be significant from the perspective of presenting a hazard to future astronauts or infrastructure across much of the lunar surface," Fernando et al wrote in the study.

dozens of people smile for a portrait in front of a large white cylinder in a massive warehouse

A SpaceX photo of one of the company's Falcon 9 second stages, taken in 2022. A similar second stage is expected to impact the moon in August 2026. (Image credit: SpaceX)

Before and after

Brent Garry is a project scientist for NASA's Lunar Reconnaissance Orbiter (LRO) at Goddard Space Flight Center in Greenbelt, Maryland. LRO will be passing over the projected rocket stage crash site about seven days prior to the impact and about seven days after the impact, Garry explains.

"After the impact we might have a little bit more knowledge of where it is. We can do some additional targeting about a week after the impact and get some targeting over where the site is," said Garry, as noted in earlier Space.com reporting.

Meanwhile, Jo at the University of Texas, Austin underscores the fact that a spent rocket stage is a hollow, spacecraft-like body, and there are very few impact models for human-made objects like it. They seem to produce very different plumes than natural impactors, like asteroids or comets do. But Jo stresses that the real scientific contributions will come by studying the moments after the impact.

"My concern is that most observers will stop at the sub-second flash and never track down the ejecta, which is the part that should actually be visible, and where the science is."

  •  

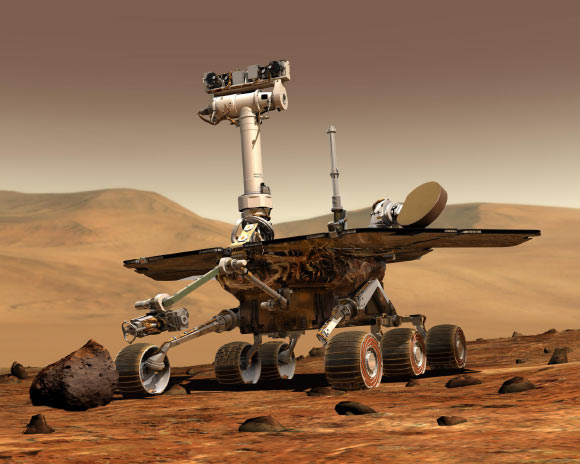
Hidden Clues in Spirit Rover Data Suggest Mars Once Had Far More Water than Scientists Realized

NASA’s Spirit rover on Mars. Image credit: NASA.

A new look at more than two decades’ worth of archival data from NASA’s Spirit mission suggests that the Martian soil may hold iron-bearing minerals -- hematite and altered magnetite -- that were too faint for scientists to detect in real time during the mission.

The post Hidden Clues in Spirit Rover Data Suggest Mars Once Had Far More Water than Scientists Realized appeared first on Sci.News: Breaking Science News.

  •  

Researchers May Have Solved a Two-Thousand-Year-Old Stellar Mystery Recorded by Ancient Astronomers

For more than two millennia, astronomers have puzzled over a stellar mystery recorded by some of history’s greatest skywatchers. Hipparchus, Ptolemy, and the Persian astronomer al-Sufi—all separated by more than 1,000 years—each described Theta Eridani as one of the brightest stars in the night sky. Yet today, the previously celebrated star barely ranks among the more noticeable stars visible to the naked eye.

A new astronomical study published on arXiv suggests that those ancient observers may have unknowingly recorded an extraordinarily rare stellar event. The star system remained dramatically brighter than normal for roughly a millennium before fading back to its present appearance sometime between the 10th and 16th centuries.

If confirmed, the finding would be among the longest-lived stellar transients ever proposed, fusing modern astrophysics with historical astronomy to reconstruct an event spanning centuries rather than days or months.

The study combines historical star catalogs with state-of-the-art observations from the European Southern Observatory’s Very Large Telescope Interferometer (VLTI), high-definition spectroscopy, and NASA’s Transiting Exoplanet Survey Satellite (TESS).

Together, those observations allowed the researchers to reconstruct the architecture and evolutionary state of the Theta Eridani system and to propose a physical mechanism that could explain its mysterious ancient brilliance.

“The remarkable combination of orbital and stellar parameters hints that the historical brightening of Theta Eridani was due to a millenary transient phase,” researchers write. “This strengthens the case that the apparent brightening was real and not due to an error by three different ancient observers, as has been commonly claimed in the past.”

Today, Theta Eridani, also known by its traditional name Acamar, shines at approximately magnitude 2.9, making it a respectable but hardly spectacular star marking the end of the constellation Eridanus. Yet ancient records tell a very different story.

Hipparchus described it as an exceptionally bright star around 129 BC. Roughly 250 years later, Ptolemy ranked it among only fifteen first-magnitude stars in the Almagest, effectively placing it among the thirteen brightest stars visible in the night sky.

More than 800 years afterward, the Persian astronomer al-Sufi independently retained that same first-magnitude classification while revising the brightness estimates of many other stars toward values that closely match modern observations.

The sharp contrast between the historical accounts and Theta Eridani’s modest appearance today has made the star one of astronomy’s most enduring and compelling mysteries.

Researchers examined long-standing alternative explanations, including simple observational mistakes, copyist errors in ancient manuscripts, confusion with the much brighter star Achernar farther south, and even errors caused by atmospheric extinction near the horizon. One by one, they argue the evidence weighs against those explanations.

Theta Eridani would not even have been visible to the Greek and Arab astronomers because of Earth’s changing orientation over time. Likewise, statistical analyses of nearly 1,000 stars contained in the Almagest show that Theta Eridani represents the single largest discrepancy between ancient and modern brightness estimates, rather than part of a wider systematic mistake.

The historical trail eventually changes around the dawn of the Age of Exploration. By the late 1500s and early 1600s, after European navigators began mapping the southern skies, star catalogs consistently described Theta Eridani as only a third-magnitude star—essentially the same brightness observed today.

That suggests the bright phase had already ended.

To investigate whether Theta Eridani itself could plausibly have undergone such a transformation, the team turned to modern astronomical observations.

Rather than a single star, Theta Eridani consists of three stars. The primary component itself is a remarkably tight binary whose two stars orbit one another every 4.1077 days at a separation of just 0.083 astronomical units—roughly one-fifth the distance between Mercury and the Sun.

Using interferometric measurements from the VLTI, together with spectroscopy and precision photometry from TESS, the researchers determined that the two stars each contain just over twice the Sun’s mass and have swollen to approximately 4.3 and 4.0 solar radii.

Those enlarged sizes are significant because both stars have expanded to nearly 80 percent of the volume where gravity from one star begins pulling material toward the other, a region around a star in a binary system known as the Roche lobes. The close gravitational interaction also produces measurable ellipsoidal distortions that TESS detects as subtle, rhythmic brightness variations every orbit.

Researchers’ evolutionary modeling further revealed that the primary star occupies an unusually brief stage within stellar evolution, having only recently exhausted hydrogen in its core and begun transitioning into a subgiant. That evolutionary timing may be critical.

According to the researchers, Theta Eridani may once have possessed a much more elongated orbit. As the primary expanded, it could have begun overflowing its Roche lobe during each close approach, transferring material toward its companion and possibly generating an extended common envelope surrounding both stars.

Unlike the violent stellar explosions astronomers typically classify as transients, this proposed event would have evolved extraordinarily slowly. Instead of lasting weeks or years, the researchers suggest the envelope may have persisted for roughly a thousand years while gradually extracting orbital energy from the binary.

Because the surrounding envelope would have remained optically thick, it could have radiated from an area far larger than either star individually, making the entire system appear nearly ten times brighter than it does today.

Researchers’ calculations suggest that such an envelope could have reached roughly 20 times the Sun’s radius while needing only a tiny amount of encircling material, because that material would be continually replenished and slowly ejected over hundreds of thousands of orbits.

Importantly, researchers stress that this is still a proposed physical explanation rather than a demonstrated one. Modeling the detailed hydrodynamics of eccentric mass transfer and long-lived common envelopes remains beyond the scope of the current work.

Nevertheless, they argue that the unusual combination of orbital geometry, stellar evolution, and historical observations makes the scenario physically plausible.

The study of Theta Eridani also raises wider implications for time-based astronomy.

Modern astronomical surveys are exceptionally good at finding dramatic events that unfold over minutes, days, or years. A stellar brightening lasting centuries, or even a millennium, would be almost impossible to recognize within a human lifetime. Researchers suggest there may be other long-duration stellar transients hidden among ordinary-looking stars whose histories have been forgotten.

If their interpretation proves correct, some of humanity’s earliest astronomers may have unknowingly documented one of the most unusual stellar phenomena ever proposed—not an exploding star, but a binary system trapped in an exceptionally slow evolutionary episode which lit up the night sky for generations before quietly receding into obscurity.

“Although modern photometric surveys have had an observational coverage of a few years to a few decades rather than two millennia like Theta Eridani, they are sensitive to objects up to 14 magnitudes fainter than the naked eye limit,” researchers write. “Therefore, there could be unexplored or unexplained Theta Eridani-like transients that either brightened or faded in current data.”

The team’s new study, The Forgotten Bright Star: Theta Eridani as a Millenary Stellar Transient Observed by Hipparchus, Ptolemy and al-Sufi, is currently available on the arXiv.org preprint server.

Tim McMillan is a retired law enforcement executive, investigative reporter and co-founder of The Debrief. His writing typically focuses on defense, national security, the Intelligence Community and topics related to psychology. You can follow Tim on Twitter: @LtTimMcMillan.  Tim can be reached by email: tim@thedebrief.org or through encrypted email: LtTimMcMillan@protonmail.com 

  •  

Need advice on a Video Downloader

First off; I realise that I can - and have - searched the Web; but at the end of the day, the best advice comes from actual users.

My needs: YouTube would be a bonus rather than an essential.

I want to download videos from legitimate medical sites and similar sites that demonstrate "how to do things".

I would like to download videos - paid for and free - in general. That covers a wide group of material, I understand that.

Ideas from those who regularly download such as the above...

Read more
  •  
  •  

Barnard’s Star Contains Inhospitable Exoplanets—But They Could Still Tell Us Something Important in the Search for ET

The small exoplanets of our Sun’s second-nearest neighbor, Barnard’s Star, are inhospitable wastelands, British astronomers say.

Located six light-years from Earth, Barnard’s Star is separated from our closest neighbor, Alpha Centauri, by about 66° in our sky. Now, University of Cambridge researchers have revealed their findings on this exosolar system in a recent paper published in the Monthly Notices of the Royal Astronomical Society.

After careful analysis, the astronomers announced that the exoplanets are unlike any in our solar system, presenting a brutal and barren environment.

Barnard’s Star Exoplanets

Scientists only discovered these four small planets orbiting Barnard’s Star in 2025. Unlike anything in our solar system, these orbital bodies fit into a size range larger than Mars, but smaller than Earth or Venus.

Like a peeled onion, these smaller planets are rich in a mineral only found deep below the Earth’s surface. Chemical analysis revealed large amounts of the mineral periclase on the surface of these planets, something typically only found hundreds of kilometers deep on our planet.

“Barnard’s Star has an enormous amount of the element magnesium compared to other stars, so its planets are likely to be rich in magnesium too,” said lead author Xander Byrne from Cambridge’s Institute of Astronomy. “On Earth, that magnesium goes into making minerals called olivines, which are really important for storing water within the planet.”

A Lack of Water and Atmosphere

Unfortunately for those looking for extraterrestrial life, magnesium serves a different purpose on these exoplanets. Instead of water-storing olivine, it produces the abundant periclase, which is a poor store of water.

Even worse, these inhospitable exoplanets likely no longer have an atmosphere. According to the University of Cambridge team, these ten-billion-year-old planets probably only managed to hold an atmosphere for two billion years at most.

“These planets were always going to be hostile, because they’re really close to their star,” said Byrne. “Even the outermost planet orbits ten times closer than Mercury orbits the Sun. When you’re that close to your star, and have such little gravity, your atmosphere just gets blown off.”

In addition to the lack of atmosphere, the planets’ proximity to Barnard’s Star leaves them tidally locked, like our Moon, with one side always facing toward the star.

Exoplanet Stability

However, there is one positive element to these small planets. Typically, such close-orbiting systems are highly unstable, with the planets shooting out from the system, falling into their host star, or catastrophically colliding. Yet in this case, the system is as ordered as a piece of music. 

The three inner planets of the exosolar system have years in a 9:12:16 ratio, producing two of what is known as a “perfect fourth” in music. This musical harmony is known as an orbital resonance, with the same type of effect stabilizing Jupiter’s moons in their orbits around that planet. 

While our ability to view Barnard’s Star from Earth may be limited, the European Space Agency’s upcoming Plato mission may allow astronomers to discover ever smaller worlds orbiting in the nearby exosolar system.

“Larger planets are much easier to detect than small ones, so we know about very few sub-Earth planets like the ones in this system,” said Byrne. “But the sensitivity of these new missions will help to reduce this bias, allowing us to discover more and more planets that are small and rocky, like Earth.”

The true significance of the research may lie in the value of a null result. While these planets are bleakly hostile to life, observing this exosolar system’s composition can aid future astronomers in narrowing down the search for extraterrestrial life.

The paper, “The Barnard’s Star Planetary System: Stability, Composition, and Evolution of Four Sub-Earth Exoplanets,” appeared in Monthly Notices of the Royal Astronomical Society on June 24, 2026.

Ryan Whalen covers science and technology for The Debrief. He holds an MA in History and a Master of Library and Information Science with a certificate in Data Science. He can be contacted at ryan@thedebrief.org, and follow him on Twitter @mdntwvlf.

  •  
❌