❌

Normal view

1,700-year-old legendary Roman-era submerged bridge found in Switzerland’s Solothurn

7 June 2026 at 18:20

A long search has finally concluded: Swiss divers have discovered a legendary Roman-era bridge that researchers have been trying to locate for decades. It may be the only pile trestle of its kind that exists.

As plans were underway to construct a bridge over the Aare River, Swiss archaeologists hired by Cantonal Archaeology conducted routine archaeological investigations in the area near Solothurn, Switzerland, which has long been a subject of interest for archaeologists.

A bridge pier, known as a pile trestle, was believed to have been built in this location. Archaeologists were eager to investigate due to the area’s “strategic geography” and “its position along an important transalpine trade and military route.”

And finally, as construction work would be carried out, archaeologists were hired by Cantonal Archaeology to take the plunge, which they did several times, guided by previous accounts of the presence of “stakes” in the waters. On fins, they came to discover a row of timber piles near Solothurn’s Wengi Bridge.

The piles, just under 6.56 feet long and arranged in the direction of the current, provided the first physical evidence of a pile trestle ever found. Upon analyzing the wood and remnants of the bridge pier, they confirmed its existence, dated it to the 4th century, and established that it was linked to the city’s development as a castrum, or fortified settlement.

A major bridge pier

This long-sought bridge was part of a major road connecting Italy with the Rhine River, according to LBV. Sections of this road had already been identified on either side of the river, suggesting that a bridge must have existed to facilitate crossings.

For years, archaeologists contended that the riverbed near Solothurn could contain a pile trestle due to the unique characteristics of this small municipality in Switzerland. The Aare River narrows at a point near the town, which helped archaeologists estimate where the bridge might have been constructed.

Historically, Salodurum is the Latinized version of a Celtic toponym that means “river narrows” or “gateway of the waves.” Until now, no physical evidence had been found, only rumors of “stakes” underwater.

Previously, it was known that the Romans settled in this area between the 1st and 3rd centuries. In the 4th century, a defensive wall was constructed in response to instability and military pressures, leading to the fortification of urban settlements. This bridge symbolizes an empire striving to protect itself from its ultimate demise.

A system of defense

A castrum wasn’t a town wall, but rather a system, Arkeonews clarified. Solothurn, a picturesque town today, once held strategic importance due to its placement on the Aare. This region was well-developed and interconnected by imperial routes. The Romans built this bridge pier to enhance a gateway crucial for preventing significant losses. The settlement lying beneath the Baroque center even reveals how the Romans intentionally selected this spot for its strategic value.

Because the 1,700-year-old wood would decay if exposed to air, the construction project will not disturb the precious timbers submerged in the river, allowing them to remain in their watery grave. They represent the Roman Empire at a pivotal time in its history.

Archaeologists will continue investigating the bridge, Heritage Daily concludes, and they hope to glean new insights into their methods of construction and how it functioned in this vast network that linked the Mediterranean and Northern Europe.
💾

Swiss divers have discovered a legendary Roman-era bridge that researchers have been trying to locate for decades

Dominican Republic Families Flee Gold Mine Pollution as Canada’s Watchdog Office Remains Empty

7 June 2026 at 11:00
Dominican Republic Families Flee Gold Mine Pollution as Canada’s Watchdog Office Remains Empty

In the Dominican Republic town of La Piñita, 65-year-old Leoncia Ramos fears for her health and wants to leave the home she’s known her entire life. She’s one of 450 families demanding relocation from what they say is dangerous pollution from the nearby Pueblo Viejo gold mine, operated by Canadian mining giant Barrick Mining Corp.

The community has spent 15 years fighting to address their environmental and health concerns, alleging the mine is contaminating their surroundings. Residents also worry about catastrophic flooding if a tailings dam located just one kilometer away were to collapse. Their struggle highlights a broader accountability gap in international mining operations.

Canada, which hosts about half of the world’s publicly traded mining companies, created the Canadian Ombudsperson for Responsible Enterprise (CORE) in 2019 to investigate human rights complaints against Canadian corporations operating overseas. However, this critical oversight position has sat vacant for the past year, leaving communities like La Piñita without recourse as their complaints pile up.

The timing couldn’t be worse. Global demand for transition minerals is surging as countries race to build clean energy infrastructure, while shifting geopolitical dynamics are intensifying pressure on mining operations worldwide. Environmental advocates warn that without proper oversight, vulnerable communities will continue bearing the environmental costs of resource extraction while corporate accountability remains elusive. The empty watchdog position underscores how regulatory gaps can leave affected populations with few options for addressing environmental harm from international mining operations.

The post Dominican Republic Families Flee Gold Mine Pollution as Canada’s Watchdog Office Remains Empty first appeared on EnviroLink Network.

Shell Operated Leaking Nigeria Pipeline for Years Despite Knowing Environmental Risks to Mangrove Forests

7 June 2026 at 11:00
Shell Operated Leaking Nigeria Pipeline for Years Despite Knowing Environmental Risks to Mangrove Forests

Internal company documents reveal that oil giant Shell knowingly continued operating a severely compromised pipeline in Nigeria’s Niger Delta for years, despite being aware it posed significant pollution risks to the region’s precious mangrove ecosystems. The communications show that senior executives were informed as early as 2008 about the deteriorating conditions of the 97-kilometer Nembe Creek Trunk Line, yet chose to keep the oil flowing rather than shut down operations for repairs.

The pipeline, which carries 150,000 barrels of oil daily to export terminals, became a source of repeated environmental disasters as thieves tapped into the line through illegal connections, causing massive spills into the surrounding wetlands. Company documents from 2013 classified such compromised pipelines as requiring immediate shutdown or urgent remedial action, yet operations continued. The resulting oil contamination has devastated the region’s mangrove forests, which are home to diverse species of Rhizophora and Avicennia trees that form critical coastal ecosystems.

Local communities have paid a devastating price for Shell’s decision to prioritize profits over environmental protection. Residents of the nearby Bille community report that approximately 2,000 hectares of mangrove swamps have been killed by oil spills, with contamination affecting a total area of 13,200 hectares. The pollution has destroyed fish populations and other aquatic life that local communities depend on for their livelihoods. Satellite imagery confirms the massive scale of mangrove degradation around affected villages, showing the long-term environmental consequences of operating damaged oil infrastructure in sensitive coastal ecosystems.

The post Shell Operated Leaking Nigeria Pipeline for Years Despite Knowing Environmental Risks to Mangrove Forests first appeared on EnviroLink Network.

Here are the best electric bikes you can buy at every price level in October 2026

17 October 2026 at 14:08

I’ve spent countless hours here at Electrek doing detailed hands-on testing of hundreds of electric bikes. Through thousands of miles of riding, I’ve been fortunate to learn these e-bikes inside and out, top to bottom and front to back. That long-term experience with real-world e-bike testing has helped me find the best electric bicycles on the market for just about any budget.

Below are some of the top e-bikes I’ve hand-tested for every price range, current as of October 2026. Fall weather is upon us, bringing cooler temps and beautiful views, so it’s a great time to hop in the saddle and get out there riding! Check out the awesome e-bikes below, any one of which could become your next electric bike.

more…

One Detroit-area Hyundai dealer wants $400 to charge your car

5 September 2026 at 15:20

Drivers opening an EV charging app for the first time today will be presented with thousands of so-called “public” chargers at local car dealers. Once they arrive, however, the store’s customers, store hours, security gates, and Wild West pricing can turn what should be a routine charging stop into a frustrating ordeal. For first-time EV drivers, that doesn’t just reflect poorly on the dealer – it reflects poorly on the EV, itself. And we need to fix it.

UPDATE 05SEP2026: another Hyundai store, another $418 bill.

more…

Banco Central libera ferramenta que BLOQUEIA contas falsas no seu CPF #AssistênciaTec

6 June 2026 at 22:00

💾

Você sabia que alguém pode abrir uma conta bancária no seu nome sem você perceber? Agora o Banco Central lançou o BC Protege+, uma ferramenta gratuita que bloqueia a abertura de contas no seu CPF sem autorização. Veja o passo a passo completo e proteja seus dados agora mesmo contra golpes, fraudes bancárias e contas falsas.

#BancoCentral #BCProtege #GolpesOnline #SegurançaDigital #CPF #GovBR #Tecnologia #Fraudes #DicasDeTecnologia #YouTubeShorts

Scientists ejected from diabetes conference for distributing journal reprints

Five leading scientists were ousted from the annual meeting of the American Diabetes Association (ADA) in New Orleans on Friday. Their crime: handing out copies of an editorial, published in the journal Diabetes Care on April 29, sharply criticizing the Trump administration's ongoing attacks on scientific research.

Those ousted were Steven Kahn, professor of medicine at the University of Washington and editor-in-chief of Diabetes Care, who co-authored the published editorial; former ADA President Desmond Schatz of the University of Florida, Gainesville; Aaron Kelly, pediatrics professor at the University of Minnesota; Justin Ryder of Northwestern University; and Irl Hirsch, also of the University of Washington. The five were handing out reprints of the editorial outside a room where NIH director Jay Bhattacharya had been scheduled to speak. Bhattacharya canceled and another NIH official spoke in his stead.

"They physically grabbed us, forced us out of the conference center, and now are telling us we can no longer attend this meeting," Kelly told MedPage Today, which first reported the incident. "They're taking our lanyards. It really has come to this in America. Censorship is real. America needs to stand up. Scientists, stand up. Physicians, stand up."

Read full article

Comments

© Screenshot/MedPage Today

Duke Energy Set to Receive $28.4 Million in Federal Funds for Coal Plant Upgrades in North Carolina

6 June 2026 at 21:01
Duke Energy Set to Receive $28.4 Million in Federal Funds for Coal Plant Upgrades in North Carolina

Duke Energy is poised to receive $28.4 million in federal taxpayer funding to upgrade two aging coal-fired power units at its Roxboro plant in Person County, North Carolina. The federal grant would be supplemented by an additional $44 million from ratepayer funds, bringing the total investment to over $72 million for the coal facility improvements.

The funding announcement comes as Person County residents are already grappling with significant energy infrastructure changes in their community. The area is simultaneously dealing with the construction of new natural gas power plants, pipeline development, and a proposed Microsoft data center that would dramatically increase local energy demand.

The Roxboro plant upgrades are part of a broader national initiative, with similar coal plant improvement projects planned across 13 locations nationwide. This federal investment in coal infrastructure represents a notable shift toward supporting fossil fuel facilities at a time when many utilities are transitioning away from coal-fired power generation due to environmental concerns and economic factors.

The timing of these coal plant upgrades has raised questions among environmental advocates about the long-term energy strategy for the region, particularly given the concurrent natural gas development and the growing energy needs from technology companies establishing data centers in North Carolina. The combination of these projects signals a continued reliance on fossil fuel infrastructure despite ongoing climate commitments at state and federal levels.

The post Duke Energy Set to Receive $28.4 Million in Federal Funds for Coal Plant Upgrades in North Carolina first appeared on EnviroLink Network.

Washington DC Pop-Up Museum Confronts Americans with Personal Cost of Climate Disasters

6 June 2026 at 21:00
Washington DC Pop-Up Museum Confronts Americans with Personal Cost of Climate Disasters

What would you grab if you had just minutes to evacuate your home before a wildfire or hurricane struck? Your family photos? A beloved pet? That handmade quilt from your grandmother?

This deeply personal question lies at the heart of the Museum of Unnatural Disasters, a powerful new pop-up exhibit that has opened in Washington DC. The interactive display forces visitors to confront the human reality behind climate change statistics by focusing on the impossible choices people face when extreme weather threatens everything they hold dear.

The museum brings together an unlikely coalition of voices – disaster survivors sharing their harrowing experiences, lawmakers grappling with policy responses, and activists demanding urgent action. Through personal stories and immersive displays, visitors experience what it means to lose a lifetime of memories to rising floodwaters or watch irreplaceable family heirlooms turn to ash in a wildfire.

The exhibit arrives at a critical moment as extreme weather events become increasingly frequent and severe across the United States. By transforming abstract climate data into visceral, emotional experiences, the museum aims to bridge the gap between scientific warnings and public understanding. Rather than overwhelming visitors with statistics about global temperature rise, the display asks them to imagine their own most treasured possessions at risk, making the climate crisis intensely personal and immediate.

The post Washington DC Pop-Up Museum Confronts Americans with Personal Cost of Climate Disasters first appeared on EnviroLink Network.

Mass Measurements of the Double Neutron Star System PSR J0641+0448

5 June 2026 at 17:00
Z. L. Yang et al 2026 ApJL 1000 L1
Using the Five-hundred-meter Aperture Spherical radio Telescope, researchers have discovered and measured the spins and masses of a pair of neutron stars using the pulsar timing method.

The post Mass Measurements of the Double Neutron Star System PSR J0641+0448 appeared first on AAS Nova.

The First Dedicated Survey of Atmospheric Escape from Planets Orbiting F Stars

4 June 2026 at 17:00
Morgan Saidel et al 2026 AJ 171 257
A survey of six gas giants orbiting F-type stars suggests that atmospheric escape of these planets is determined by the X-ray and extreme-ultraviolet output of their host stars as well as the Roche filling factor.

The post The First Dedicated Survey of Atmospheric Escape from Planets Orbiting F Stars appeared first on AAS Nova.

Measuring the Distances to Asteroids from One Observatory in One Night with Upcoming All-Sky Telescopes

3 June 2026 at 17:00
Maryann Benny Fernandes et al 2026 Planet. Sci. J. 7 76
Using simulations of 20 asteroids from 0.05 to 2.4 au away, researchers demonstrate how the technique of topocentric parallax could be used to determine the distance to an asteroid in a single night.

The post Measuring the Distances to Asteroids from One Observatory in One Night with Upcoming All-Sky Telescopes appeared first on AAS Nova.

The First Starspot Spectrum Revealed by JWST

2 June 2026 at 17:00

M-dwarf star with starspots

Editor’s Note: Astrobites is a graduate-student-run organization that digests astrophysical literature for undergraduate students. As part of the partnership between the AAS and astrobites, we occasionally repost astrobites content here at AAS Nova. We hope you enjoy this post from astrobites; the original can be viewed at astrobites.org.

Title: A Panchromatic JWST Spectrum of a Giant Starspot on the Fully Convective M Dwarf TOI-3884
Authors: C. A. Murray et al.
First Author’s Institution: University of Colorado Boulder
Status: Published in ApJ

We often picture stars as smooth, glowing spheres, as if they’ve been run through an Instagram filter. But real stars have spots: cooler, darker regions on a star’s surface caused by strong magnetic fields.

Annoyingly, these spots can seriously interfere with how we study exoplanet atmospheres.

How to Probe a Planetary Atmosphere

Planetary atmospheres are often probed through transmission spectroscopy. When a planet transits its star, some starlight passes through the planet’s atmosphere before reaching us. We can distinguish the light that has passed through the planet’s atmosphere by comparing the star’s light in transit versus out of transit. In doing so, we can isolate the atmospheric spectrum and look for absorption features of species like water or oxygen.

Easy, right?

How Starspots Get in the Way

Things get more complicated once we stop thinking of the star as if it’s been smoothed out by an Instagram filter. Starspots are cooler than the surrounding stellar surface, which means they emit a different spectrum. They are also constantly changing: new spots can form, old ones can disappear, and the star’s rotation carries them in and out of view. This changes things.

First of all, your star’s spectrum changes over time, which could mean that the star’s spectrum out of transit is not the same as the star’s spectrum during transit. On the other hand, the planet may transit across a starspot instead of a “normal” stellar region. In this case, the light we measure during the transit is affected by the spot, and it is no longer accurate to directly compare it with the overall stellar light outside the transit.

Ultimately, absorption features that we thought were from the planetary atmosphere could actually be coming from starspot contamination instead.

Starspot Models: Our Solution?

To deal with this, astronomers build starspot models, where they vary the spots in terms of the following:

  • The surface covering fraction: this parameter tells us how much of the stellar surface is covered in spots
  • The temperature contrast: this parameter tells us how much cooler (in ratio) the spot is compared to the rest of the stellar surface, and by proxy how much dimmer

These models are promising, but how do we know that we have chosen the right parameters?

A Unique Laboratory: TOI-3884

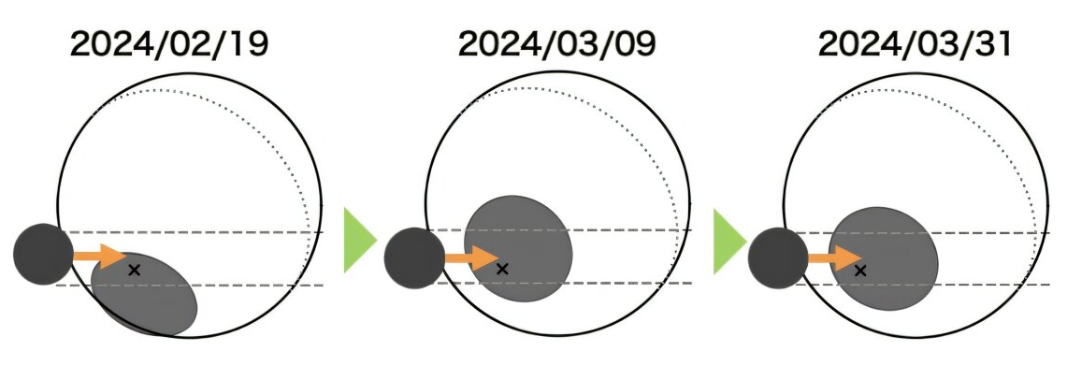
The TOI-3884 system is a unique laboratory for testing our starspot models. As seen in Figure 1, it has very convenient starspot geometry, with a large starspot located close to its pole. On top of that, we observe this star almost completely pole-on, which means that we always see this starspot, no matter how much the star rotates. To top this all off, the star hosts a close-in planet, which orbits the star from pole to pole.

Illustration of the TOI-3884 system

Figure 1: Illustration of the TOI-3884 system. The pole (and rotation axis) of the star is indicated with a black “x,” indicating that we see the star almost pole-on. The polar starspot is indicated in grey, and the transiting planet TOI-3884b is indicated in black. Different dates are shown, illustrating how the system evolves over the span of a few weeks. [Adapted from Mori et al. 2025]

The planet transits the star, and as it does so, it always passes over the polar starspot. This gives us a rare opportunity to probe the spectrum of a starspot. Similar to how we can use normal in/out of transit observations to probe a planetary atmosphere, we can now compare the observations during/after a “starspot transit” to probe the starspot region. Today’s authors do exactly this using six different transit observations from JWST.

So… How Good Are Our Models?

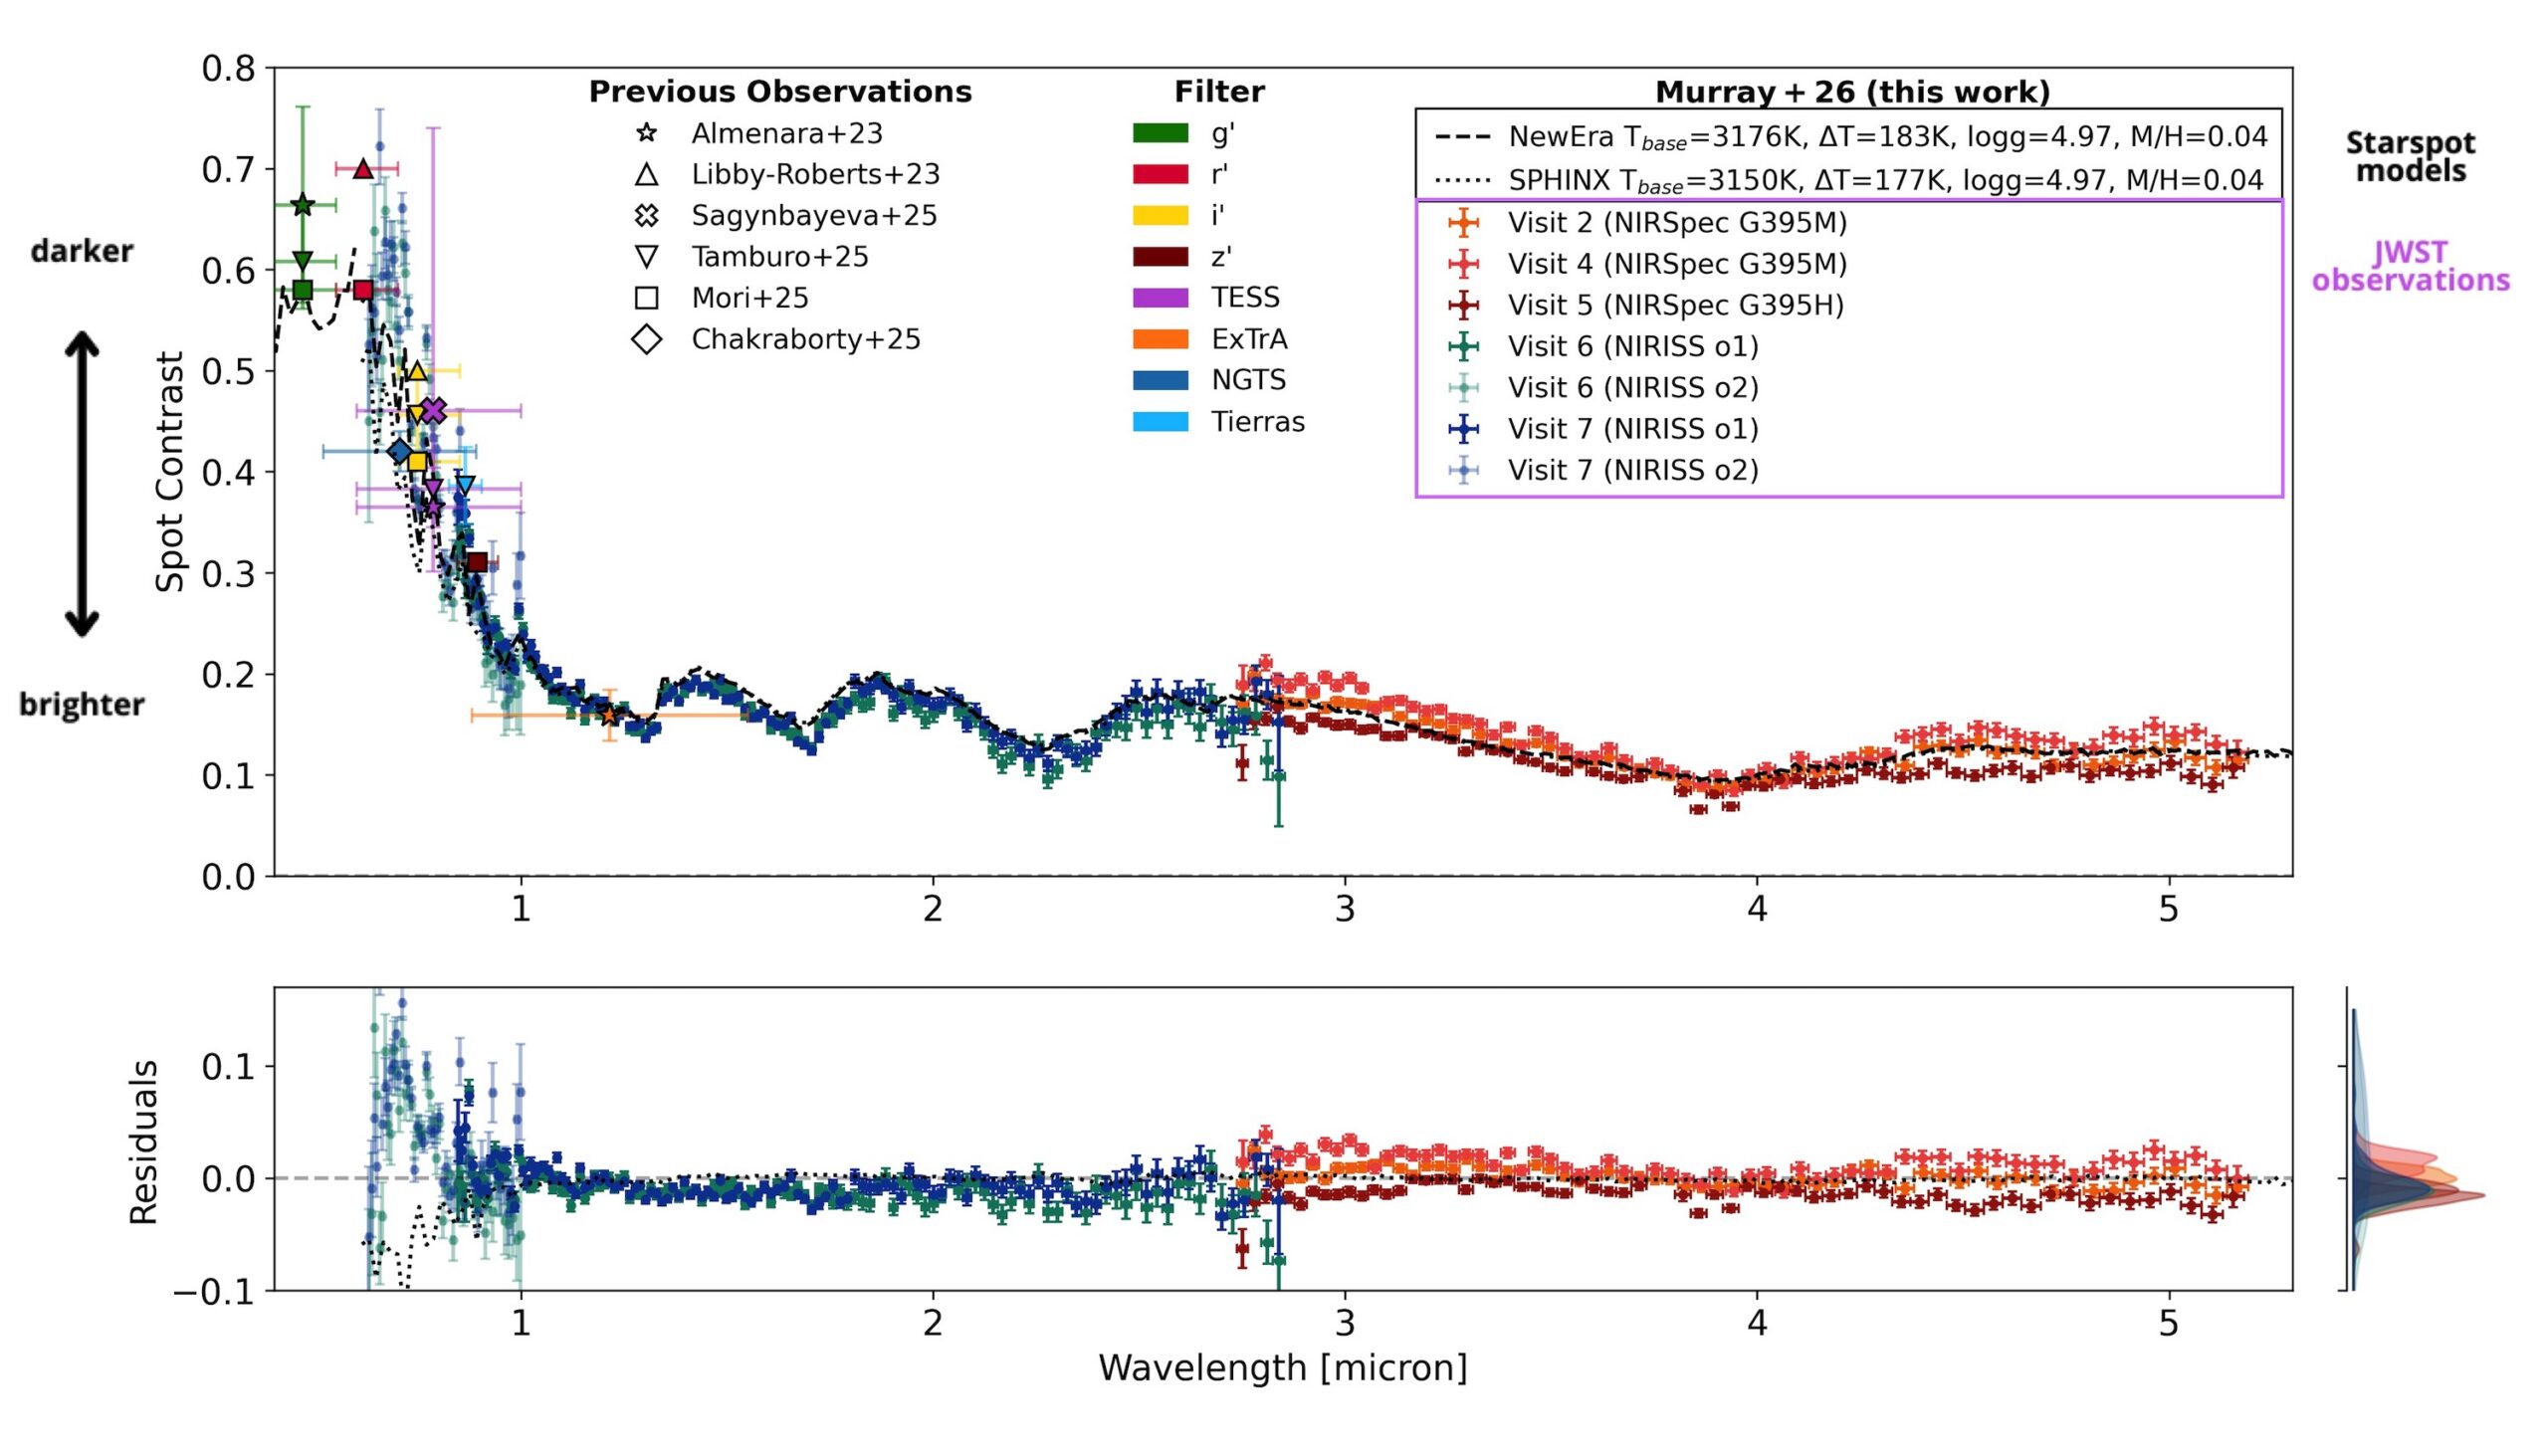
From the JWST observations, the authors extract a starspot spectrum for the first time. Figure 2 shows this as the spot contrast (how much dimmer the spot is than the surrounding stellar surface) plotted across different wavelengths. To see how well our models are doing, they compare this observed spectrum to two commonly used starspot models. The difference between the data and the models (the residual) is plotted in the lower panel.

spectrum of TOI-3884’s starspot.

Figure 2: The spectrum of TOI-3884’s starspot. The y-axis in the upper panel, the spot contrast, indicates how much dimmer the starspot is compared to the “normal” stellar surface. Different observations taken with JWST are indicated in different colored crosses, and other previous observations are overplotted in various other shapes. Model starspot spectra are shown in dashed or dotted black lines. The residuals between the model spectra and the JWST observations are shown in the bottom panel. [Adapted from Murray et al. 2026]

At wavelengths longer than about 1 micron, in the near-infrared regime, things look good! The residuals stay small, meaning the models do a solid job reproducing the observations. But move left into shorter wavelengths, in the optical regime, and the agreement quickly falls apart. The residuals grow, and it becomes clear that the models are missing something.

There’s still work to be done before we can confidently probe planetary atmospheres at optical wavelengths without worrying about stellar contamination, and this observed starspot spectrum provides a unique benchmark to test future starspot models. For now, the near-infrared remains a safer and more reliable window for planet atmosphere studies.

Original astrobite edited by Natalie Price.

About the author, Elise Koo:

I’m a PhD student at the University of Amsterdam, working to detect magnetic interactions between stars and their planets using radio and spectroscopic observations. Outside of research, I like to try out a variety of sports.

The post The First Starspot Spectrum Revealed by JWST appeared first on AAS Nova.

Predictions of Imminent Earth Impactors Discovered by LSST

2 June 2026 at 17:00
Ian Chow et al 2026 ApJ 1001 61
Simulations suggest that Rubin Observatory will discover 1–2 meter-size or larger imminent impactors each year, nearly doubling the discovery rate and providing an important set of eyes in the Southern Hemisphere.

The post Predictions of Imminent Earth Impactors Discovered by LSST appeared first on AAS Nova.

Blue Straggler in the Making: An X-Ray Active Binary in Algol Configuration

1 June 2026 at 17:00
A. H. Sheikh et al 2026 ApJL 1002 L29
Researchers have found a rare example of a blue straggler star in the process of formation, providing direct evidence for the formation of these puzzling stars through ongoing mass transfer in a binary system.

The post Blue Straggler in the Making: An X-Ray Active Binary in Algol Configuration appeared first on AAS Nova.

Dual Active Galactic Nuclei on 100 kpc Scales from the Million Quasar Catalog

29 May 2026 at 17:00
Zhuojun Deng et al 2026 ApJS 283 70
In a sample of 171 new dual active galactic nuclei, four triplets, and one quadruplet drawn from a catalog of nearly a million quasars, researchers find that roughly 16% of targets exhibit tidal features.

The post Dual Active Galactic Nuclei on 100 kpc Scales from the Million Quasar Catalog appeared first on AAS Nova.

Stacking Up the Discovery of Six Millisecond Pulsars

29 May 2026 at 17:00

Millisecond pulsar and companion artist's impression

The fastest spinning pulsars in the universe are often quite difficult to detect. Leveraging multiple observations from the largest single-dish telescope in the world, researchers have discovered six previously undetected pulsars.

Millisecond Pulsars in Globular Clusters

Globular clusters, compact collections of tens of thousands to millions of stars, are highly dense and rife with dynamical interactions. These active environments are ideal factories for the formation of millisecond pulsars — the extremely fast-spinning cores of once-massive stars, shining beams of radio emission from their poles. One way millisecond pulsars are thought to form is when a pulsar in a binary system steals mass from its companion star, transferring angular momentum and causing the pulsar to spin up. The densely packed environment in a globular cluster provides ample opportunity for a pulsar to acquire a companion to siphon.

However, millisecond pulsars in distant globular clusters are notoriously difficult to detect. Traditional pulsar searches that rely on a single observation tend to miss millisecond pulsars, many of which have signals too faint to be distinguished from noise or radio interference. Instead, researchers must rely on a different method to find these fast-spinning pulsars.

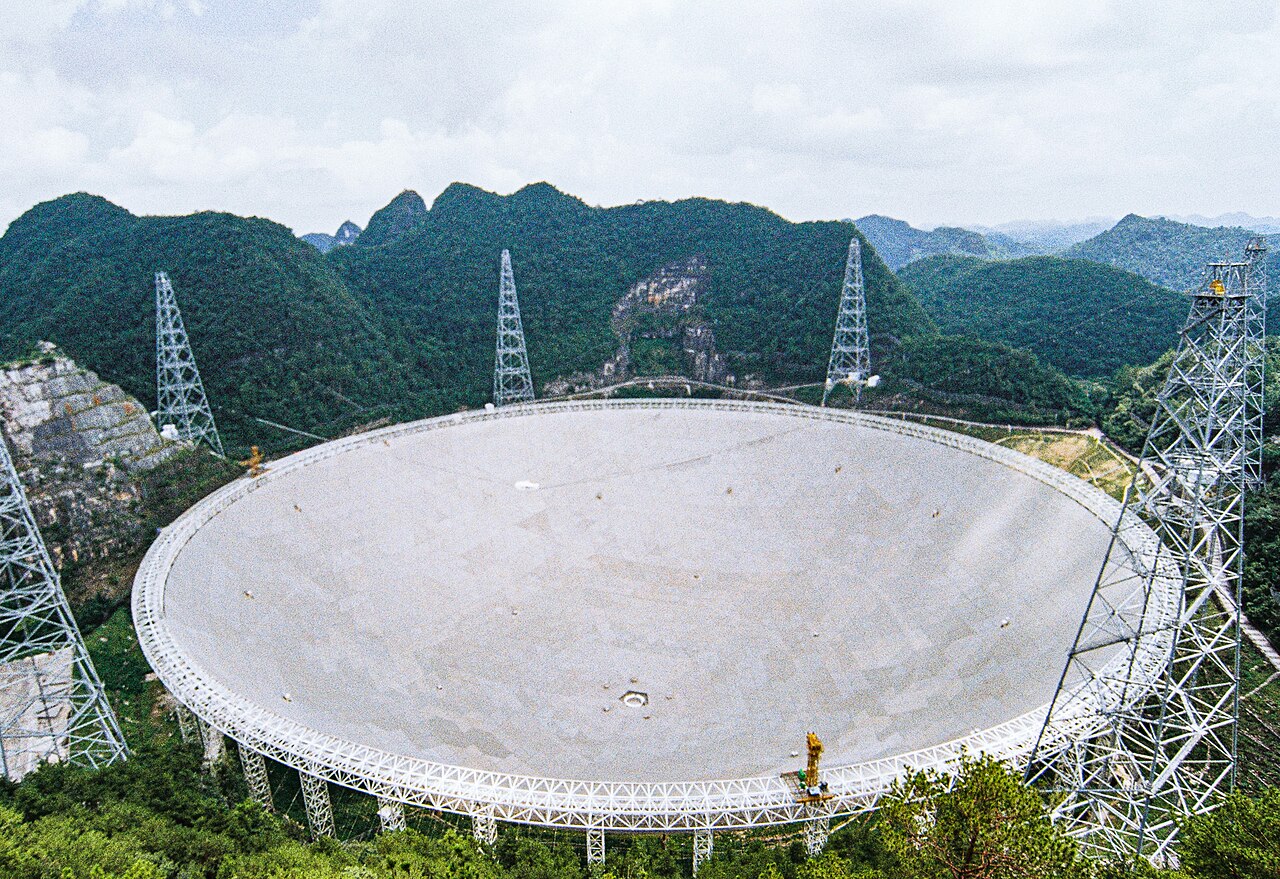
FAST

FAST, the 500-meter single-dish radio telescope located in southwestern China. [Wikipedia user SCJiang; CC BY 4.0]

Stack Search Success

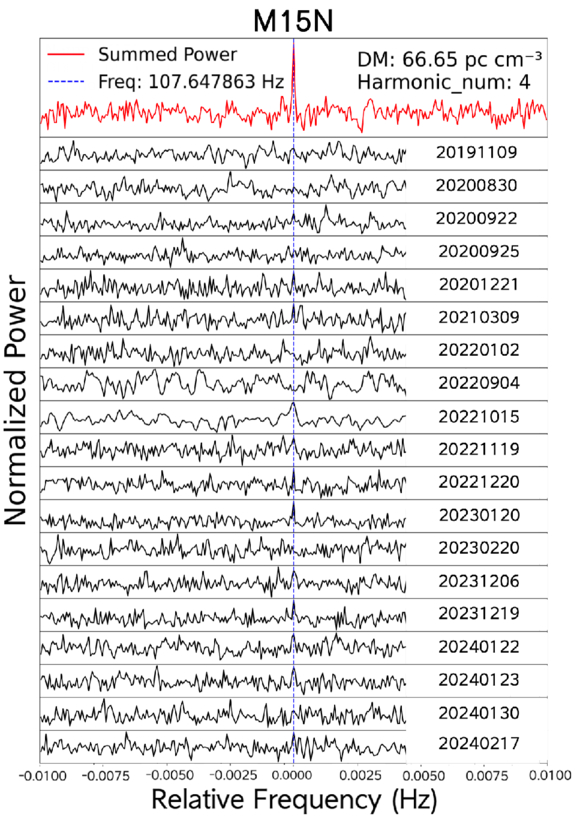
To find faint millisecond pulsars, researchers have developed the stack search method, in which multiple radio observations are combined to tease out faint signals and decrease noise. Reliably stacking observations across epochs requires stability; isolated millisecond pulsars, now no longer spinning up after losing their companion, have very stable rotation periods, making them ideal targets for the stack search method. To date, the stack search method has successfully identified nine isolated globular cluster millisecond pulsars using data from the Arecibo, Parkes, and Green Bank radio telescopes.

Stack Spectra

Power spectra from a discovered millisecond pulsar M15N. The black solid lines show the 19 individual observations of the pulsar, and the red solid line in the top panel shows the stacked spectrum. The stack search method pulls out a clear pulsar signal. [Dai et al. 2026]

In hopes of recovering more of these faint fast-spinning pulsars, Yinfeng Dai (Beijing Normal University) and collaborators used archival data obtained with the Five-hundred-meter Aperture Spherical radio Telescope (FAST), the world’s largest single-dish telescope. Targeting two specific globular clusters, NGC 6517 and M15, the team applied the stack search method to 23 and 19 observations of the globular clusters, respectively. From their search, the authors discovered six previously unidentified isolated millisecond pulsars: four in NGC 6517 and two in M15.

While previous studies identified brighter pulsars in the targeted globular clusters, the authors confirmed that all six newly discovered pulsars are too weak to be reliably recovered from single-epoch searches, underscoring the importance of the stack search method. In particular, this search increased the known pulsar populations of NGC 6517 and M15 by 27% and 18%, respectively, suggesting that a meaningful fraction of globular cluster pulsars are easily missed in traditional pulsar searches. Future studies employing this stack search method will continue to detect faint millisecond pulsars, unlocking this elusive population for further exploration.

Citation

“The Stack Search Tests on FAST Data: Discovery of Six Faint Isolated Millisecond Pulsars in NGC 6517 and NGC 7078 (M15),” Yinfeng Dai et al 2026 ApJL 1002 L31. doi:10.3847/2041-8213/ae5dbb

The post Stacking Up the Discovery of Six Millisecond Pulsars appeared first on AAS Nova.

Can the Dust Eclipses in WR 104 Provide Constraints on the System’s Inclination?

28 May 2026 at 17:00
Noel D. Richardson et al 2026 ApJ 1001 34
Researchers find a system inclination of 41.8 degrees for WR 104; this result is at odds with previous interpretations of the system’s dust plume, but a new geometric model reconciles these results.

The post Can the Dust Eclipses in WR 104 Provide Constraints on the System’s Inclination? appeared first on AAS Nova.

The Cosmic-Ray Knee as a Local Signature of Nearby PeVatrons

27 May 2026 at 17:00
Ke Fang and Francis Halzen 2026 ApJL 999 L13
The observed steepening of the cosmic-ray spectrum at ~4 PeV could be a global or local feature; a local feature could be explained by sources located ~1 kpc away with ages of 0.1–1 million years.

The post The Cosmic-Ray Knee as a Local Signature of Nearby PeVatrons appeared first on AAS Nova.

Life on the (Red) Edge

26 May 2026 at 17:00

Earth in visible and near-infrared light

Editor’s Note: Astrobites is a graduate-student-run organization that digests astrophysical literature for undergraduate students. As part of the partnership between the AAS and astrobites, we occasionally repost astrobites content here at AAS Nova. We hope you enjoy this post from astrobites; the original can be viewed at astrobites.org.

Title: Retrieving the Red Edge on Earth-Like Planets with Heterogeneous Clouds and Surfaces
Authors: Zachary Burr et al.
First Author’s Institution: Jet Propulsion Laboratory; ETH Zurich
Status: Published in ApJ

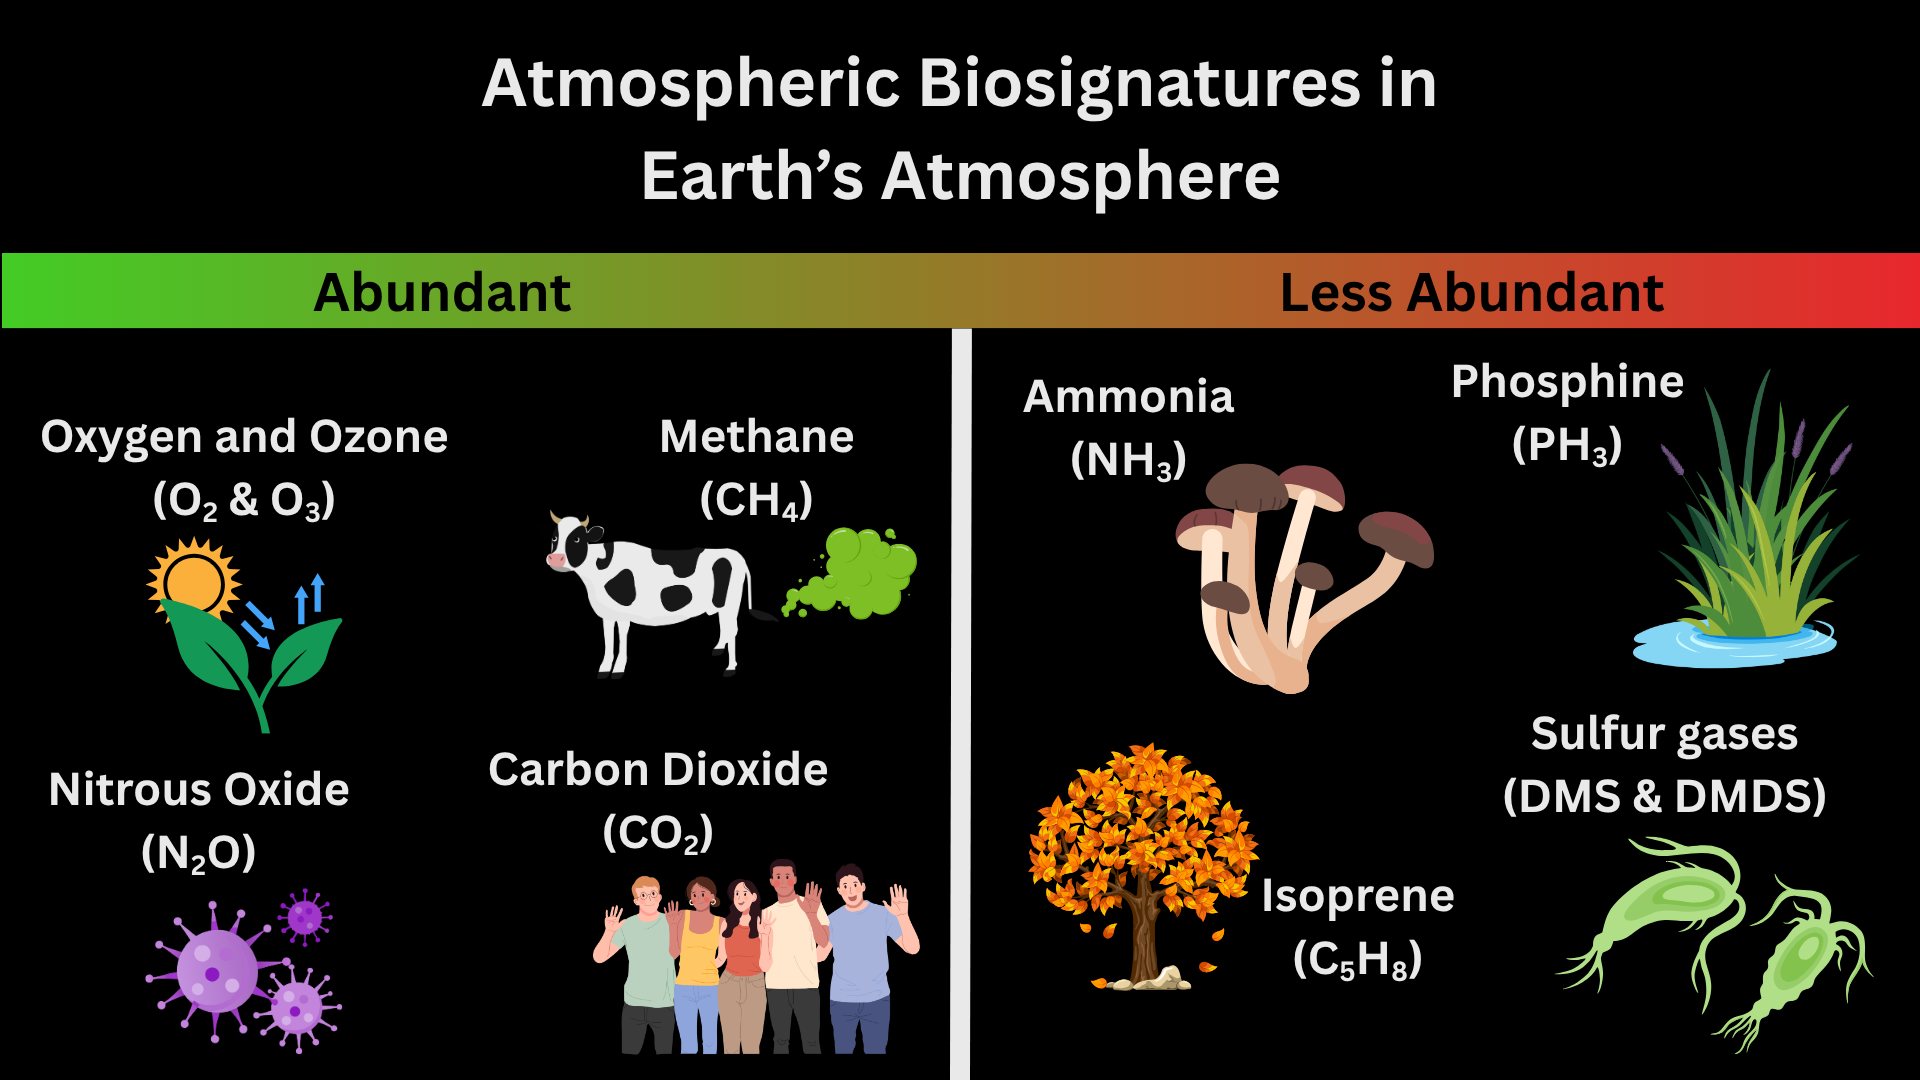
In the next 25 years, astronomers could find signs of life on other planets with the launch of the Habitable Worlds Observatory. Atmospheric signs of life, known as atmospheric biosignatures, are how astronomers currently search for life on other planets. Figure 1 shows examples of atmospheric biosignatures with pictures of each chemical’s origin on Earth. Before E.T. can phone home, though, we have to understand what chemicals make up a planet’s atmosphere. To do this, astronomers can use spectroscopy to observe a planet’s atmosphere in different wavelengths and measure the types and quantities of chemicals present.

biosignatures in Earth's atmosphere

Figure 1: Atmospheric biosignatures present in Earth’s atmosphere. More abundant biosignatures include oxygen and ozone (byproducts of photosynthesis in plants and bacteria) and nitrous oxide (byproduct of bacteria that don’t need oxygen to survive). Less abundant biosignatures include isoprene (released from the breakdown of leaves that have fallen from trees) and sulfur gases (byproducts of cyanobacteria). [Kaz Gary]

There are many ways to observe the spectrum of a planet, but the one you’re probably most familiar with is transmission spectroscopy. You can learn more about transmission spectroscopy of exoplanet atmospheres and how to model transmission spectra with these bites: 1, 2, 3. However, all of the current techniques for exoplanet spectroscopy (including transmission spectroscopy) measure the star’s light and how the planet affects the star’s light. This means it’s heavily dependent on how we model the star’s light to indirectly observe the planet’s light. The only way to take the spectrum of a planet directly is with direct imaging: the technique that the future Habitable Worlds Observatory will use to find signs of life in planetary spectra.

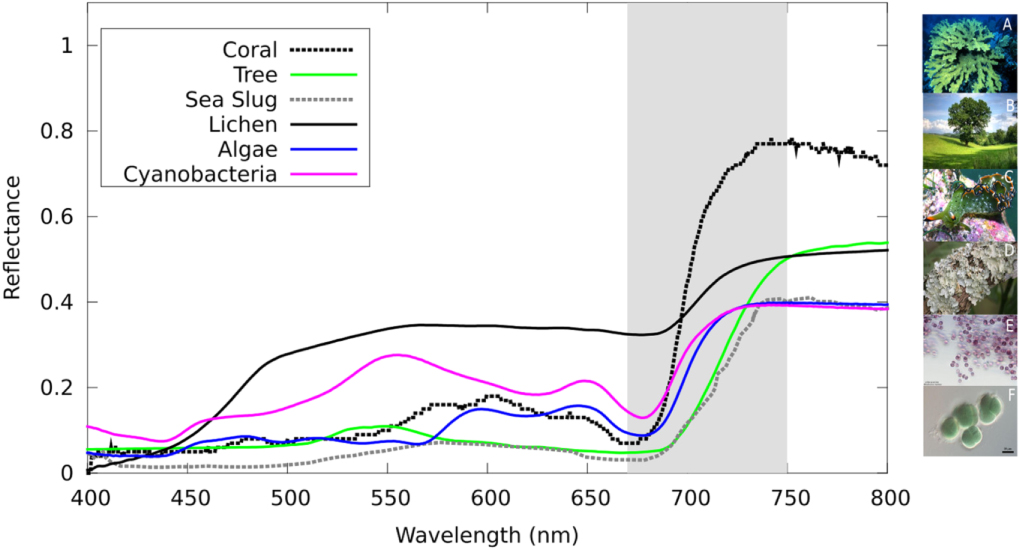
But are atmospheric biosignatures the only way to tell if life exists on other planets? Short answer: absolutely not. Let’s take Earth as an example. If we imagine Earth as a directly imaged exoplanet and take spectra of the light it reflects, you’ll find that around near-infrared wavelengths (~700 nanometers or just past the red part of the visible light spectrum), the light reflected off of Earth increases sharply. This sharp increase is called the vegetation red edge and is caused by plant and ocean life on Earth’s surface as shown in Figure 2. This is made possible because chlorophyll (the thing that makes plants green) absorbs nearly all visible light but reflects near-infrared light. The vegetation red edge is an example of a surface biosignature. In today’s article, the authors determine if the vegetation red edge will be visible in spectra of Earth-like exoplanets!

Spectra of different sources of the vegetation red edge

Figure 2: Spectra of different sources of the vegetation red edge on Earth. The vegetation red edge is highlighted in gray where the spectra rapidly increase and then level off beyond the visible light part of the spectrum. Each color represents a different source with pictures of each source on the right-hand side of the plot. [O’Malley-James and Kaltenegger 2019]

Snapshots

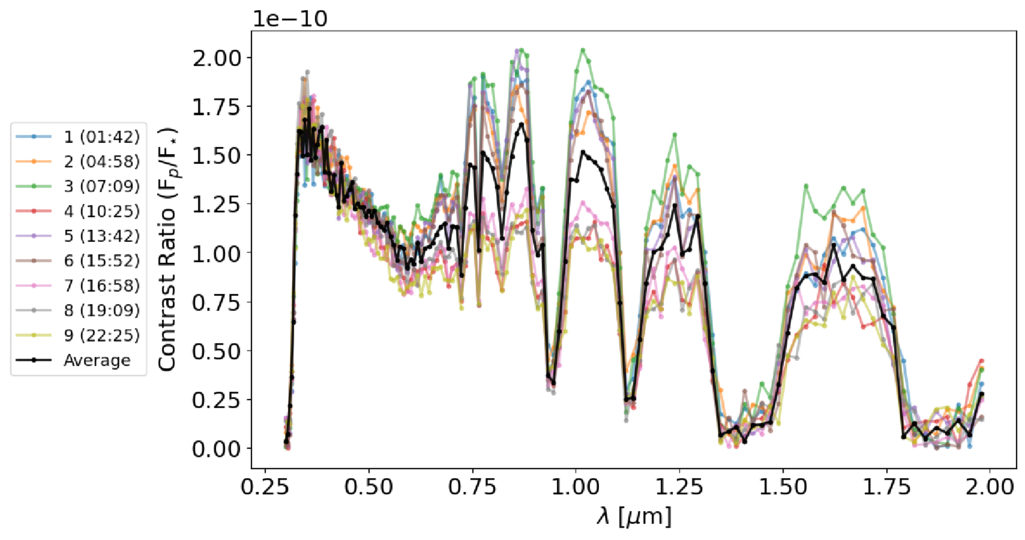
Planets rotate; that’s how we have morning, noon, and night in 24 hours guaranteed. This means that different parts of the surface will be visible at different times when we take spectra. Sometimes, we may see more ocean than land, other times not. To determine if the vegetation red edge would be visible at all points in Earth’s day, the authors simulated nine different spectra of modern-day Earth representing nine snapshots of Earth’s rotation. Additionally, they also simulated a time-averaged spectrum that shows an entire Earth day in one snapshot without the time variability. These spectra are shown in Figure 3.

Spectra of a directly imaged modern-day Earth at nine different times in its rotation

Figure 3: Spectra of a directly imaged modern-day Earth at nine different times in its rotation. The y-axis is the ratio of the planet’s signal to the star’s signal and the x-axis is wavelength in microns. Each color represents a time in UTC and the black curve represents the time-averaged spectrum. [Burr et al. 2026]

The authors then run retrieval models on all nine spectra to see if the vegetation red edge would be detectable in each spectrum, including the time-averaged one. Retrieval models take into account characteristics of the planet that would affect how light moves through its atmosphere, such as the atmospheric chemicals present and the surface gravity. They then use this information to generate possible spectral models that could fit the data. The best-fit model allows astronomers to infer what the atmosphere is made of and properties of the planet such as surface gravity. Because we are looking at Earth in visible light, much of the light from the planet is reflected. Typically, models of Earth-like planets in visible wavelengths only include atmospheric albedo: the measure of how reflective a planet’s atmosphere is. However, surface biosignatures can also be reflective as shown by the vegetation red edge. The authors use this to their advantage and introduce a surface albedo into their model that changes with the amount of desert, vegetation, and ocean visible on Earth’s surface at that time. They then further divide the nine spectra into three different types based upon the visible surface: majority land; 50% land, 50% ocean; and majority ocean. Check out the article online to see a cool animation of the Earth rotating and how the spectrum looks different at each time!

Arr! There Be… Vegetables?

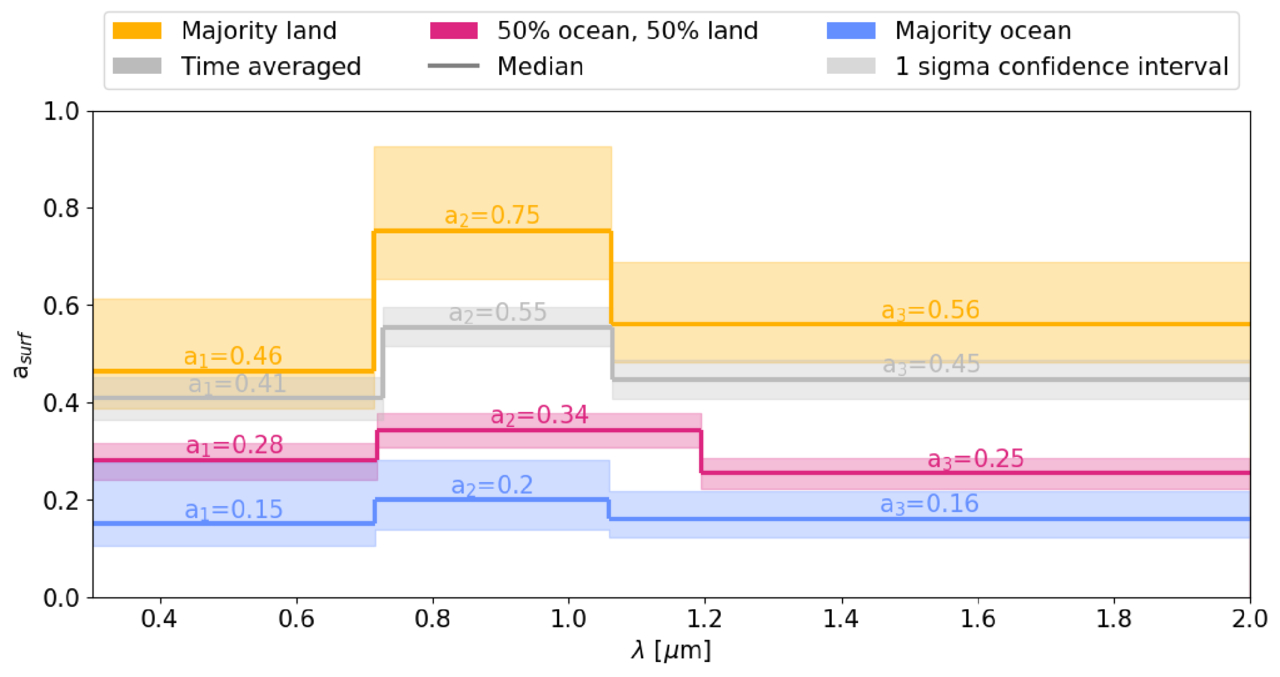
After running the models, the authors were able to detect a sharp increase in the surface albedo value in every spectrum, including the time-averaged one. This result is shown in Figure 4. The authors take this result one step further in order to validate that the vegetation red edge is actually a result of surface variation of vegetation. They re-run models on each of their spectra but instead include a constant surface albedo instead of a time-varying one. This resulted in incorrectly measured radii, chemicals, and surface gravity in nearly all of the models. Without the vegetation red edge and surface features, the models could not accurately determine if life was present on Earth.

Retrieved surface albedos for the nine time-varying spectra

Figure 4: Retrieved surface albedos for the nine time-varying spectra. The surface albedo is broken down into three different values (a₁, a₂, a₃). Each of these values represents a change in the surface albedo at different wavelengths (i.e., how reflective the surface is at three different wavelengths). The nine spectra were broken down by the amount of surface that was visible at that time and color-coded for each category. The time-averaged spectrum is shown in gray. Each category of spectra was able to retrieve an increase in reflected light from the surface at vegetation red edge wavelengths. The spectra that had the majority land visible have the biggest increase in the surface albedo. This makes sense since the amount of visible vegetation is the largest with majority-land planets. [Burr et al. 2026]

For the first time (to the author’s knowledge), the vegetation red edge has been shown to be a promising and observable biosignature in Earth-like atmospheres. This study has also laid the groundwork for future work on other surface biosignatures and their potential impact on spectra of habitable planets. Confirming signs of life in multiple different ways, both on the surface and in the atmosphere, will finally allow astronomers to say we are not alone in the universe. In fact, life likes to live on the (red) edge!

Original astrobite edited by Madison VanWyngarden.

About the author, Kaz Gary:

I am a fourth-year PhD candidate at The Ohio State University with a passion for planets. My current work focuses on modeling exoplanet observations for the Habitable Worlds Observatory and understanding planetary atmospheres. Outside of research, I help develop planetarium shows and love all forms of science communication. In my free time, I enjoy playing tabletop RPGs, painting, watching terrible reality TV, and hanging out with my pet hedgehog.

The post Life on the (Red) Edge appeared first on AAS Nova.

❌