❌

Reading view

  •  

Drawing Back the Curtain on Solar Spicules

solar spicules

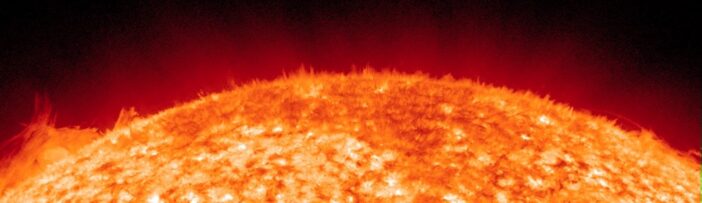
The Sun’s surface is peppered with spikes of plasma called spicules that appear to shift and twist over time. Recent simulations suggest a new explanation for the motion of solar spicules.
solar spicules

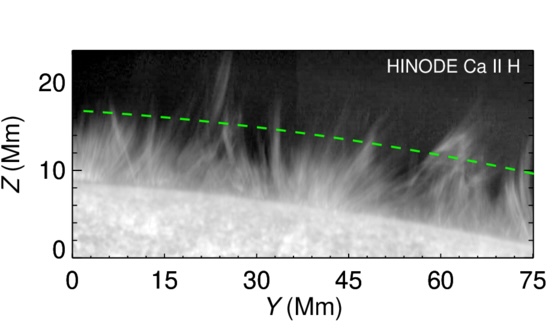
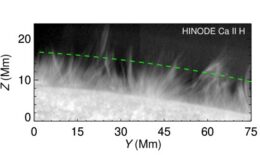
Solar spicules as seen by the Hinode mission. [Adapted from Dey et al. 2026]

Jets in Motion

Solar spicules are tiny jets of solar plasma that last just a few minutes. When viewed along the solar limb, spicules resemble blades of grass blowing in the wind. Observations show these structures moving in a variety of ways: twisting, shifting side to side, splitting, and joining together. Though spicules were first identified more than a century ago, where these motions come from is still up for debate.

In a recent research article, Sahel Dey (University of Newcastle; Indian Institute of Astrophysics; Indian Institute of Science) and collaborators performed 3D magnetohydrodynamics simulations to investigate the source of solar spicules’ motion. The team’s simulations encompassed a volume of 6,000 × 9,000 × 37,000 kilometers that stretched from beneath the visible surface of the Sun up to the lower region of the Sun’s outer atmosphere, or corona. In this region, they applied a uniform vertical magnetic field, mimicking the conditions within a coronal hole, where the Sun’s magnetic field streams outward into the solar system
simulated solar spicules

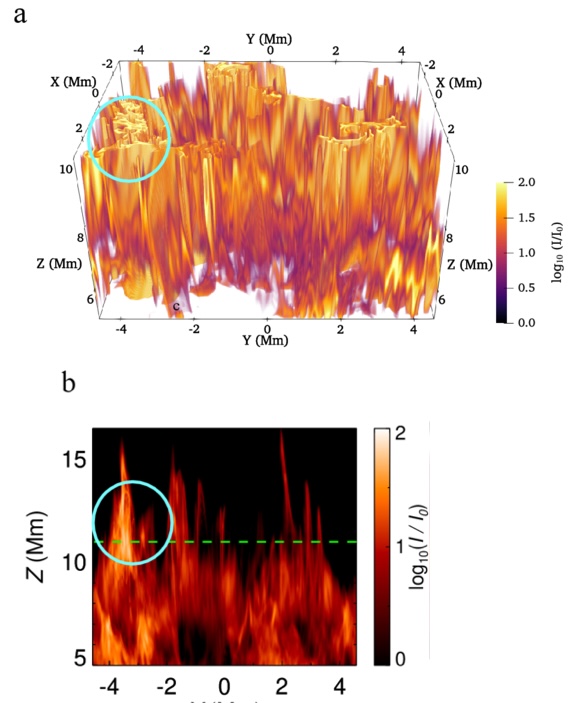
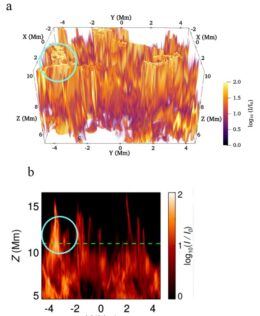
A) A three-dimensional view of simulated solar spicules, showing curtain-like structures. B) Intensity of synthetic emission from the spicules in panel A, integrated along the line of sight. The cyan circle indicates the same region in both panels. [Adapted from Dey et al. 2026]

Convection low in the simulation region generates slow magnetohydrodynamic waves, which create pockets of hot, upward-moving plasma and launch the spicules. When looking at the 3D structure of the spicules, Dey and collaborators found that they are not individual jets as they appear to be in photographs of the Sun. Instead, the sea of spicules creates an interconnected structure similar to a folded curtain.

Simulating Spicules

The jet-like appearance arises when this arrangement is viewed from the side; the team created synthetic images of their simulated spicules that show individual jet-like features. These “jets” have properties similar to those of real spicules, lasting just 5–10 minutes, journeying upward at 20–70 kilometers per second, and reaching heights of 6,000–16,000 kilometers.

These simulations clearly demonstrate that what appear to be individual jets can arise from curtain-like plasma structures. Dey and collaborators showed that this network of spicules evolves over time, buoyed upward from below by a series of shocks, pulled down gradually by gravity, and buffeted by adjacent plasma.
spicules and coronal swirling conduits

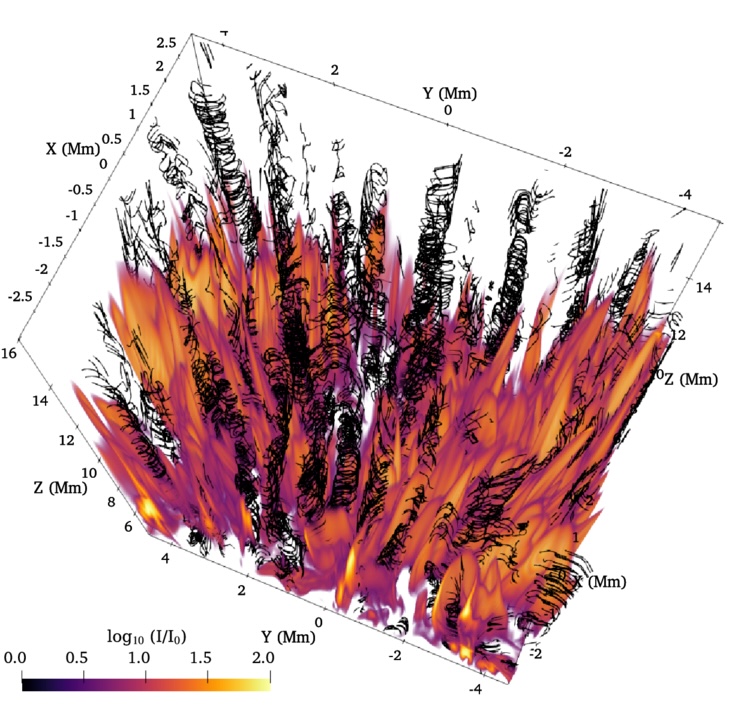
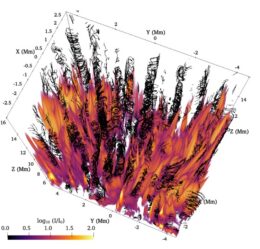
Three-dimensional view of spicules (purple–yellow regions) and coronal swirling conduits (represented by spiraling black lines). [Adapted from Dey et al. 2026]

The team showed that when spicules seem to rotate, merge, or split, these are largely apparent motions. For example, when two spicules appear to merge, this could be caused by different sections of a plasma curtain aligning along the line of sight. Some of the spicule rotation is due to what the authors term coronal swirling conduits: columns of rotating plasma interspersed within the network of spicules. These swirling plasma columns can transfer some of their motion to the spicules, especially when the spicules are falling back toward the solar surface.

This work demonstrates that a curtain-like configuration provides a viable explanation for the observed variety of spicule motions. Going forward, it will be critical to test this possibility further, as correctly interpreting the underlying structures of solar spicules is key to understanding how mass and energy are transferred to the solar corona.

Citation

“Solar Spicule Rotation Driven by Plasma Curtain–Vortex Interactions,” Sahel Dey et al 2026 ApJ 1008 132. doi:10.3847/1538-4357/ae8999

The post Drawing Back the Curtain on Solar Spicules appeared first on AAS Nova.

  •  

A New Look at a Centuries-Old Solar Eclipse

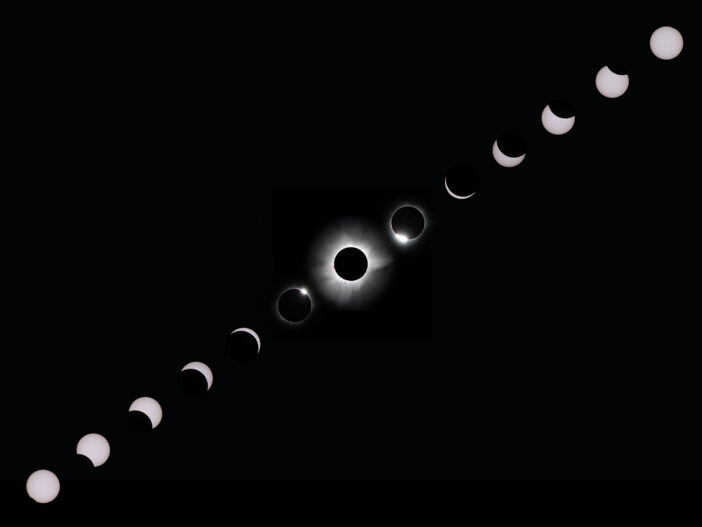
phases of a total solar eclipse

Humans have recorded solar eclipses for thousands of years. Recently, researchers translated and analyzed solar eclipse observations from 18th-century Sweden to determine the Sun’s radius at that time and study the first confirmed record of solar prominences.

Looking Back Nearly 300 Years

map showing the path of a solar eclipse

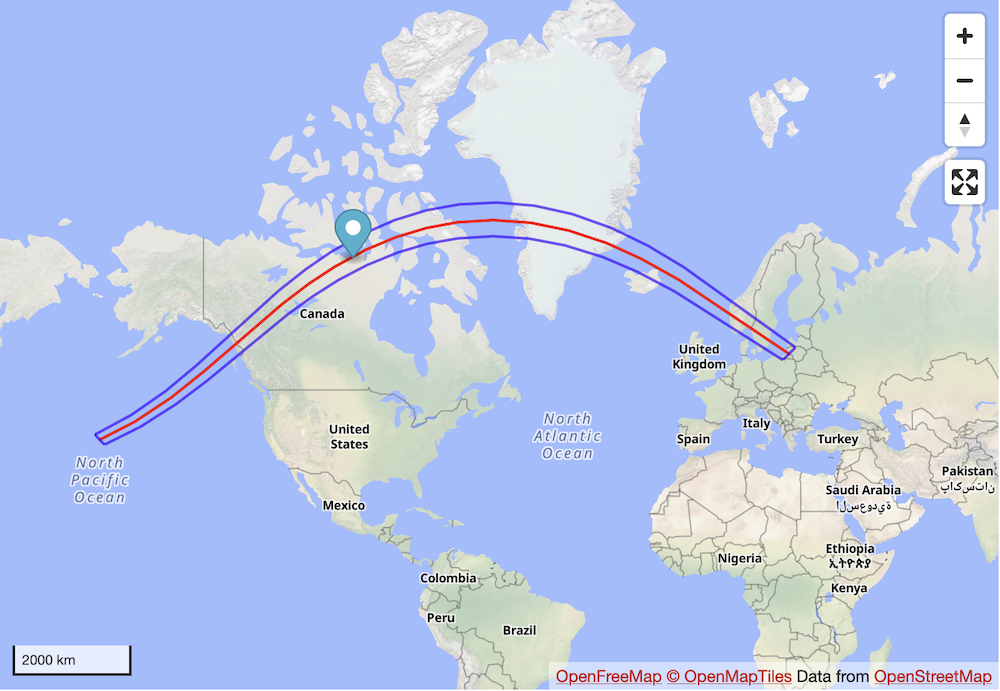
The path of the 13 May 1733 total solar eclipse. Click to enlarge. [Eclipse Predictions by Fred Espenak (NASA’s GSFC)]

On 13 May 1733, a solar eclipse darkened skies across a swath of modern-day Canada, Greenland, Iceland, and Scandinavia. Among the eclipse’s careful observers was Swedish astronomer and mathematician Birger Wassenius, who dutifully sketched the eclipse and the massive loops of plasma and magnetic fields — solar prominences — that bulged out from behind the Moon’s obscuring disk.

Wassenius penned a short account of his observations in Latin for Philosophical Transactions of the Royal Society (the longest-running scientific journal in the world!). His drawings of the event, which include the first robust record of solar prominences, were never officially published, but were housed in the Royal Academy Archives of Sweden. Now, researchers have translated Wassenius’s full report from Swedish to English and analyzed his sketches, helping to fill an important gap in the historical record of solar activity.

Drawing from Observations

Hisashi Hayakawa (Nagoya University; Rutherford Appleton Laboratory) and collaborators translated Wassenius’s notes, which describe how he viewed the eclipsed Sun through a 21-foot-long telescope during just over two minutes of totality. From Wassenius’s measurements, Hayakawa and coauthors calculated the solar radius to be 696,250 ± 170 km; this is larger than the modern accepted radius, but it’s in line with what has been calculated from solar eclipse measurements two decades earlier, in 1715.

sketch of a solar eclipse

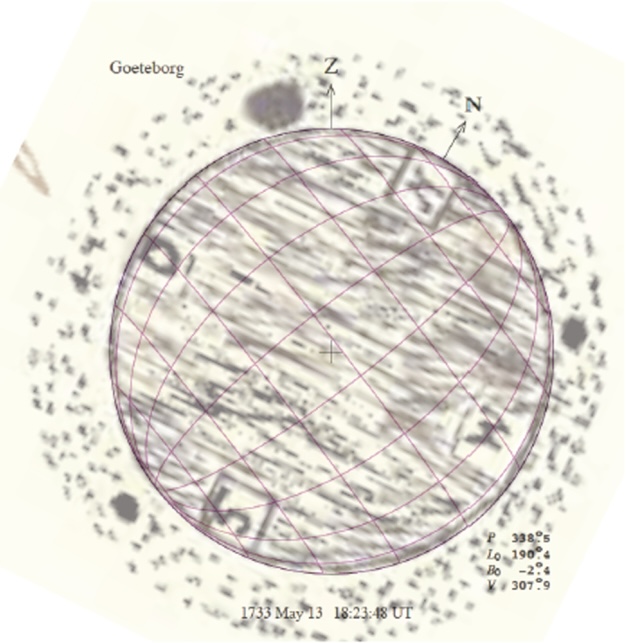
Wassenius’s sketch of the solar eclipse, showing three prominences as filled circles emerging from behind the disk of the Moon. [Adapted from Hayakawa et al. 2026]

Wassenius also made several sketches of prominences hovering above the edge of the Sun. While assessing these drawings, Hayakawa and coauthors had to contend with the imperfections of these hand-recorded features. With a narrow field of view that prevented him from seeing the entire disk at once, and with his time limited by the brief eclipse, Wassenius scribbled in two of the three prominences after the fact, from memory. After assigning reasonable uncertainties to the positions of these prominences, the team determined that at least one of these features was located at a high latitude.

Prominent Features

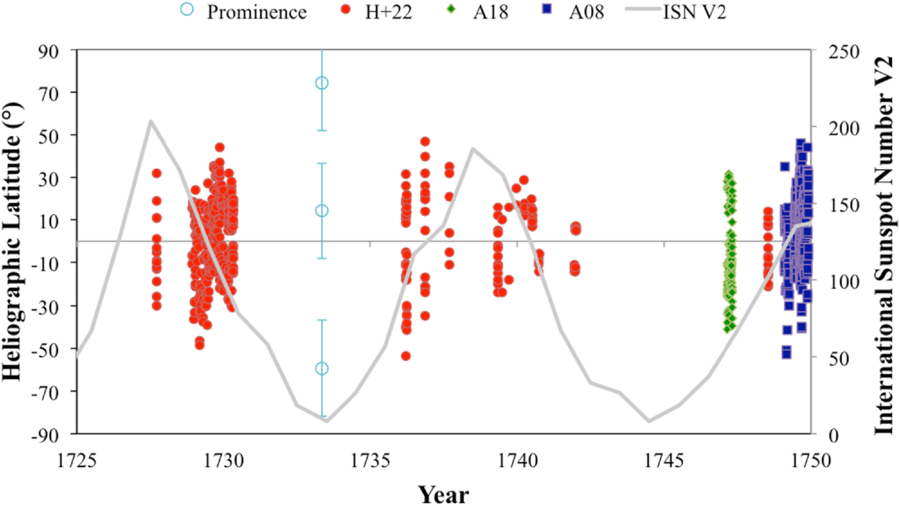
High-latitude prominences like the one (or more) seen by Wassenius are most common during what’s known as the “polar rush,” which occurs as solar activity rises toward a maximum. If these prominences are related to the polar rush, that would mean that in 1733, the Sun was not in an activity minimum as previously thought. However, it’s also possible for prominences to pop up at high latitudes during other times in the solar cycle; the authors estimated the likelihood of this happening at 20%.

plot of positions and numbers of sunspots and solar prominences

Heliographic latitude of solar prominences estimated from Wassenius’s drawings (light blue circles), compared to the positions (filled symbols) and number (gray line) of sunspots. Note that sunspot data around this time were scarce, and some researchers have suggested that revisions to the sunspot number are needed. Click to enlarge. [Hayakawa et al. 2026]

This work shows the value of historical observations in determining the Sun’s past activity cycles. The 1733 eclipse observation by Wassenius adds a fascinating data point to the long history of solar eclipse observations, helping to illuminate a time when sunspot data were scarce.

Citation

“Analyses on Wassenius’s Report for Total Solar Eclipse in 1733: Quantifications of the Solar Radius and the Earliest Reported Prominences,” Hisashi Hayakawa et al 2026 ApJ 1007 189. doi:10.3847/1538-4357/ae6451

The post A New Look at a Centuries-Old Solar Eclipse appeared first on AAS Nova.

  •  
❌