❌

Reading view

Sizing Up the Sargassum Belt

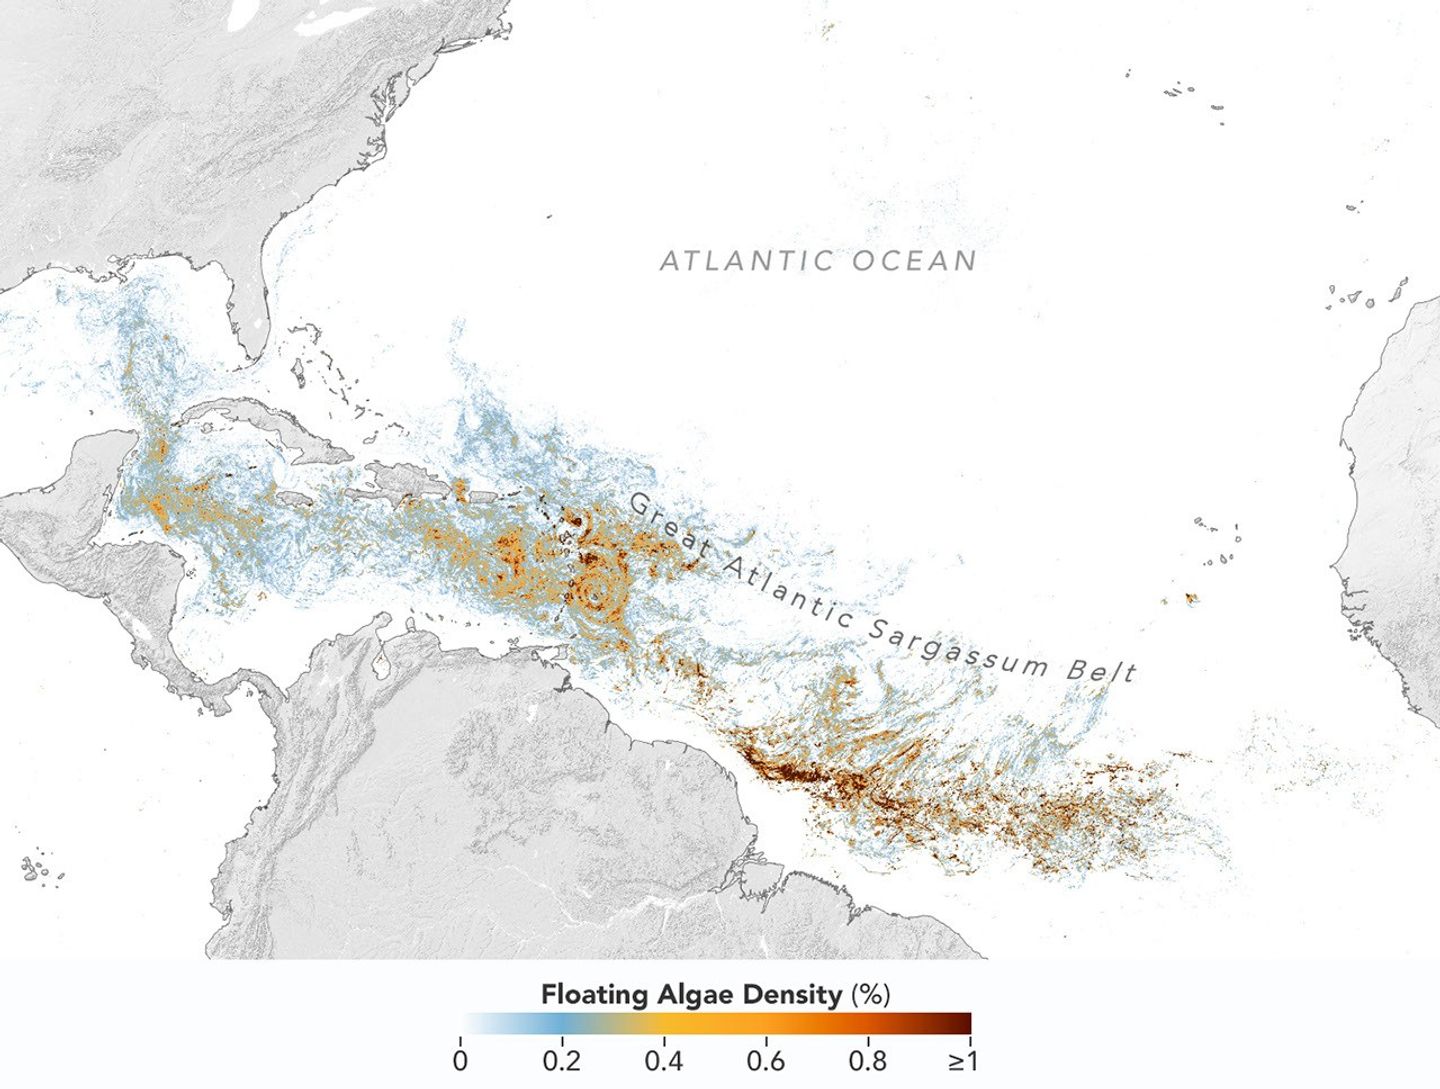
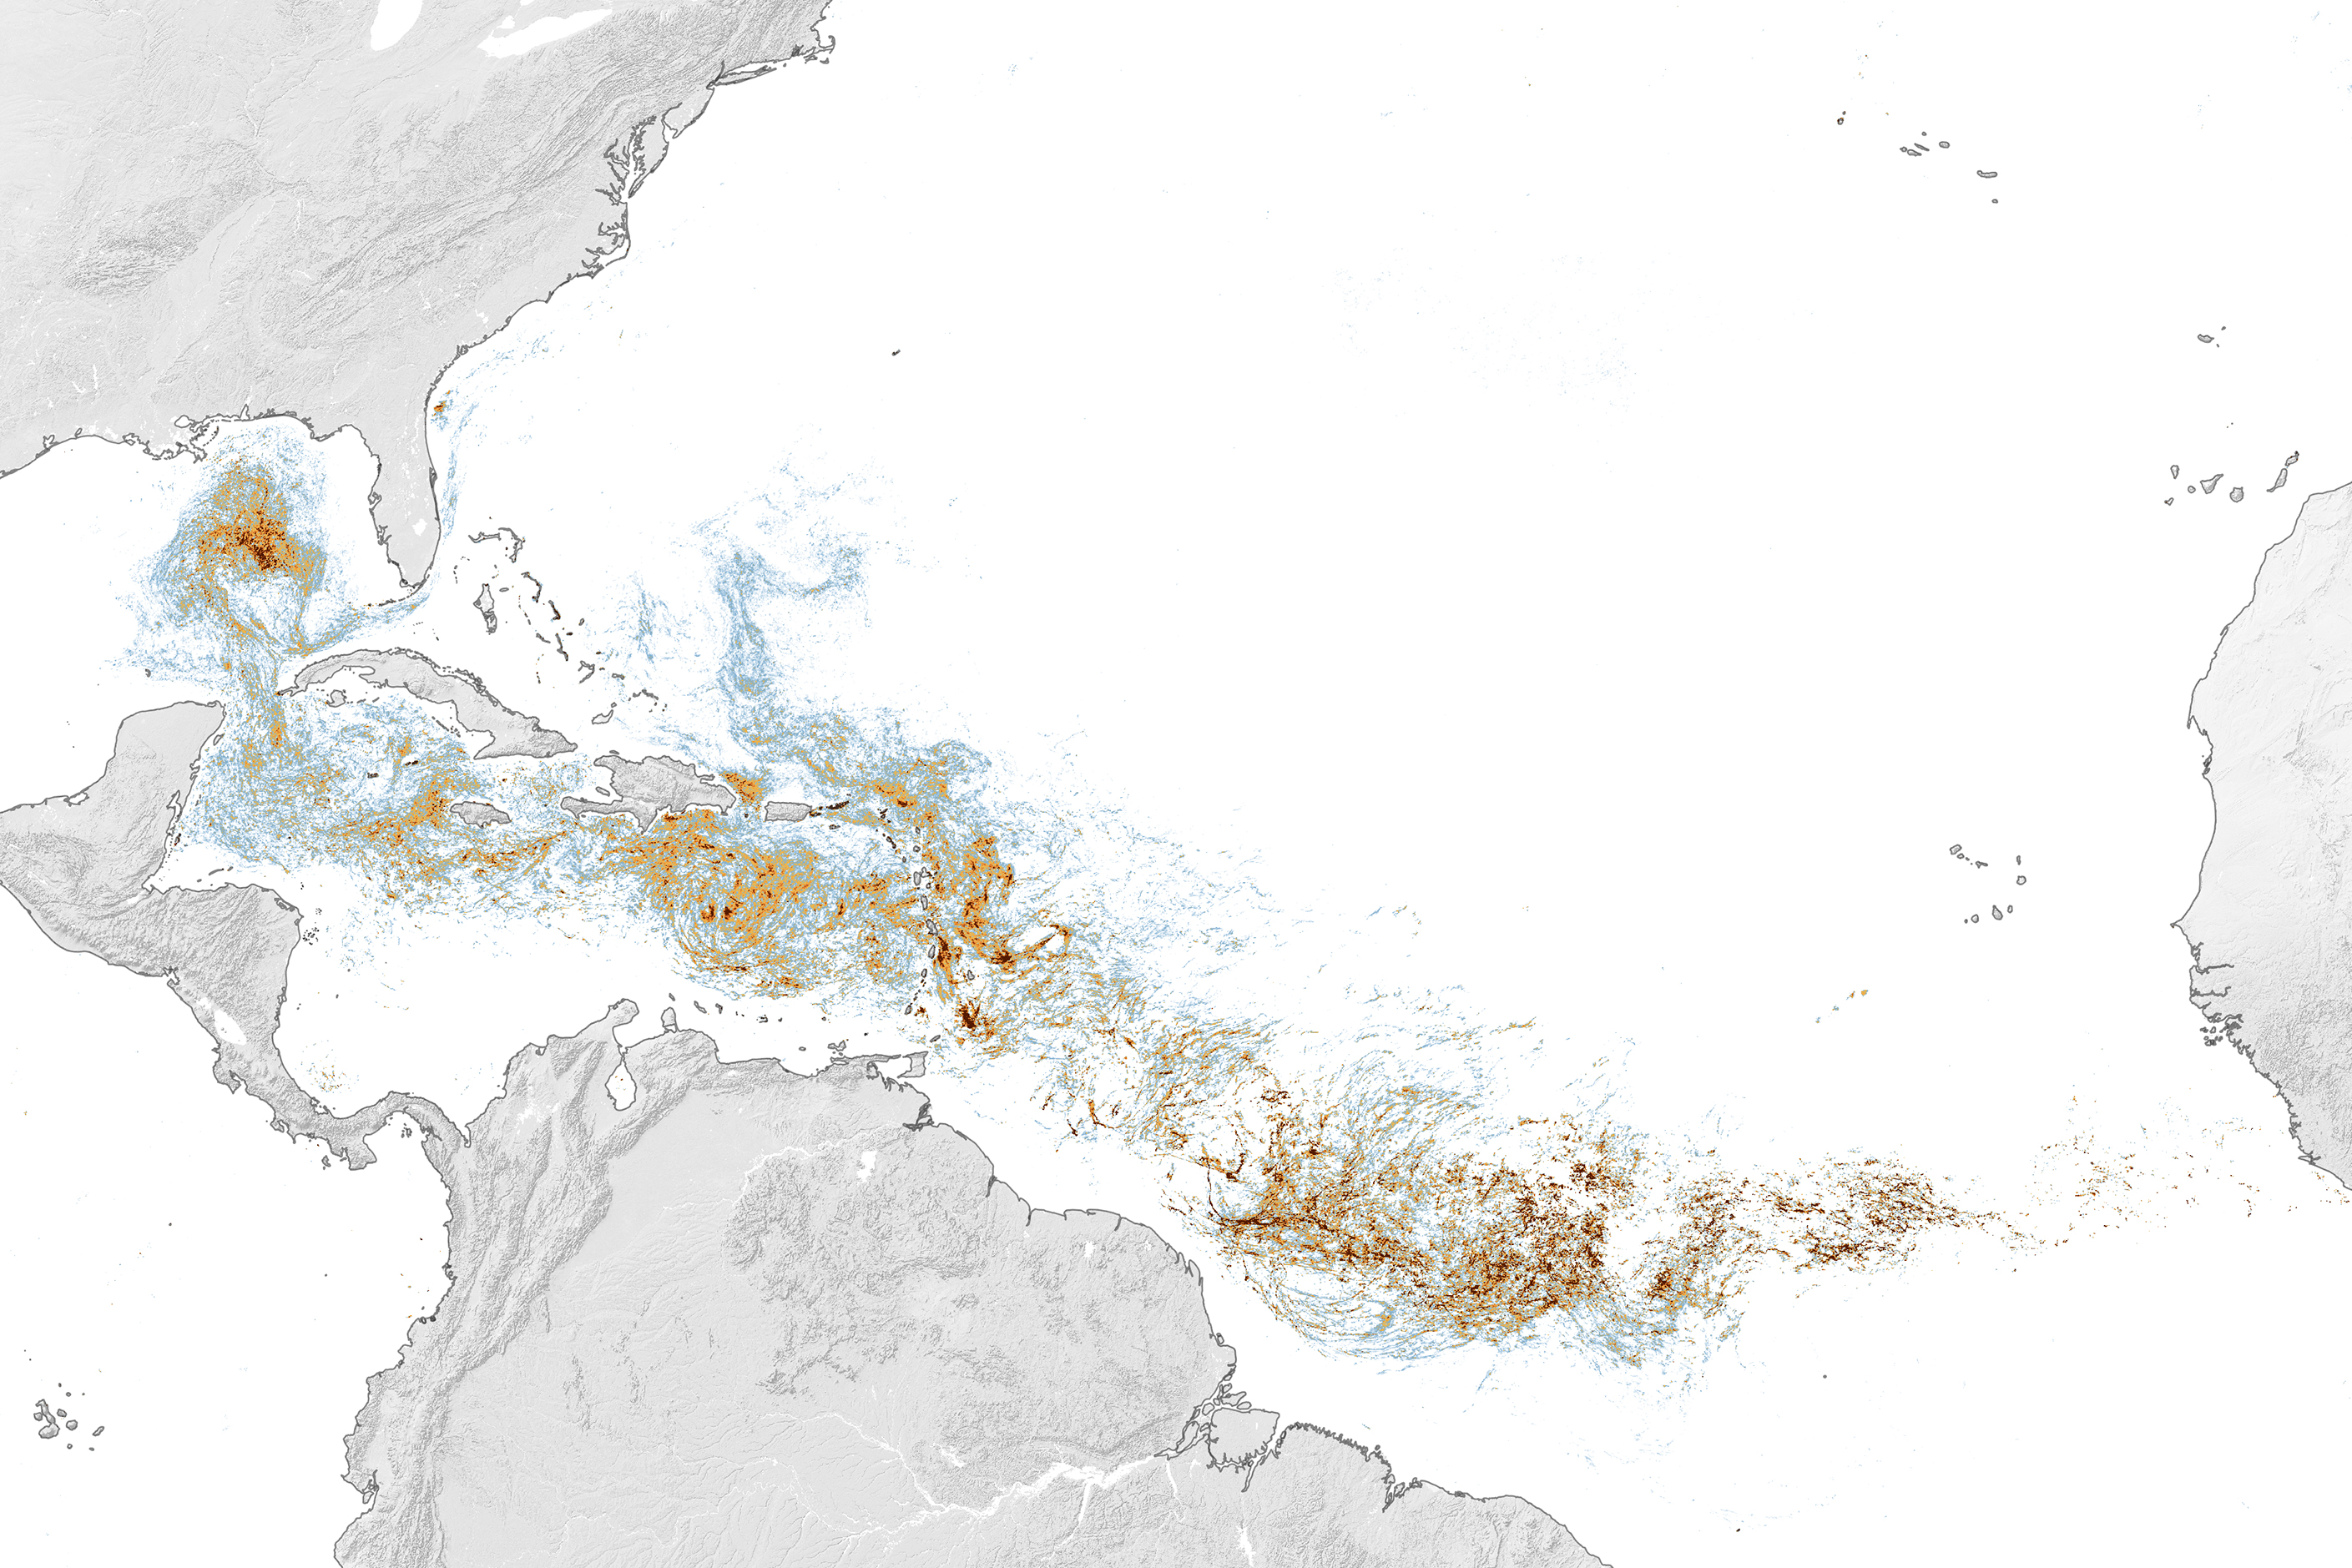
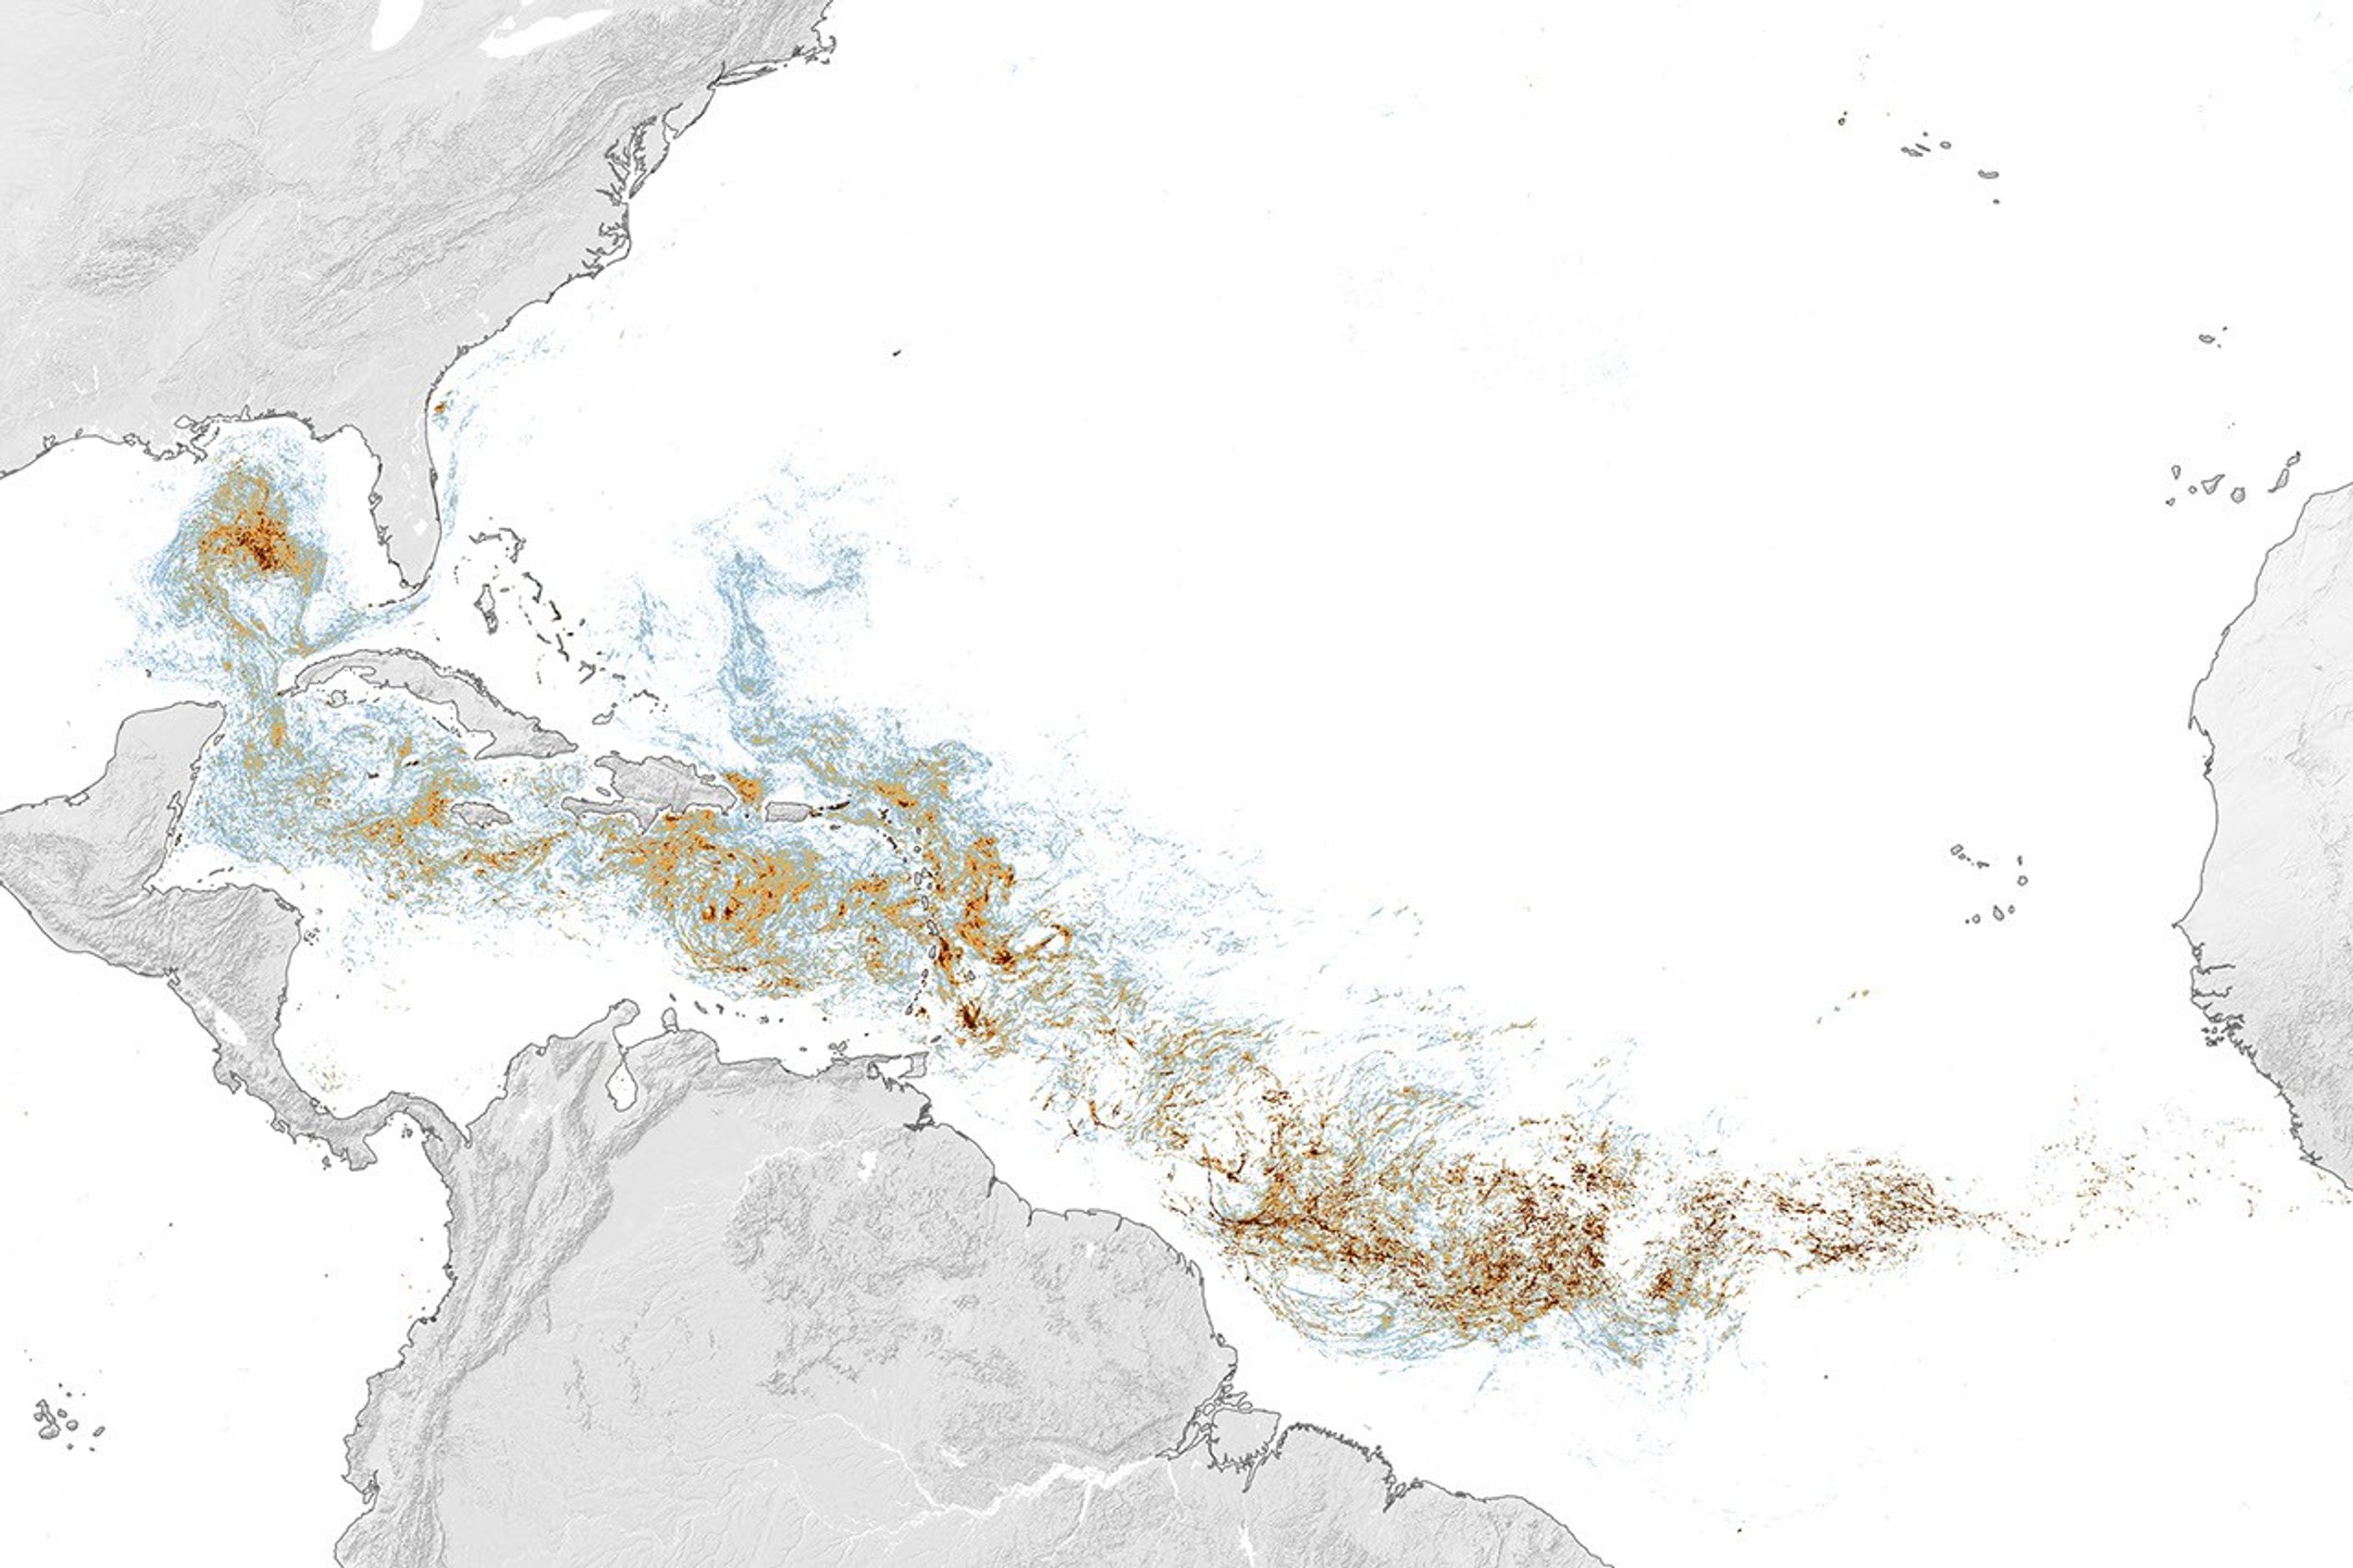
Map of the Atlantic Ocean showing Sargassum density from low (blue) to high (red) in June 2026, with the highest concentrations in the tropical Atlantic.
This map, based on data from the OCI (Ocean Color Instrument) on NASA’s PACE (Plankton, Aerosol, Cloud, ocean Ecosystem) satellite, shows Sargassum highly concentrated in the tropical Atlantic in June 2026.
NASA Earth Observatory/Lauren Dauphin

Sargassum, a type of brown floating algae, has shifted its range in recent decades, thinning out in the North Atlantic’s Sargasso Sea while proliferating in the tropical Atlantic. That trend, underway since 2011, continued in 2026 as the algae, commonly known as a type of seaweed, reached its annual peak in June across a stretch of ocean known as the Great Atlantic Sargassum Belt.

The belt’s Sargassum abundance in June 2026 made it the second-highest Sargassum year in the satellite record, slightly behind 2025, according to scientists at the University of South Florida (USF) College of Marine Science. Regionally, the Caribbean Sea and the Gulf of America (Gulf of Mexico) both hit record highs, according to USF’s June 2026 Sargassum outlook. The western and eastern Caribbean saw 3.6 and 9 million metric tons, respectively, while the Gulf saw 5 million metric tons—nearly double its previous record, also set in 2025. 

“The belt is a basin-scale phenomenon that can have devastating local-scale impacts throughout the Caribbean and Gulf, and satellite observations are the only method that captures both scales on a daily basis,” said Brian Barnes, a marine scientist at the Optical Oceanography Laboratory at USF. “The tracking done by our lab helps communities know the current extent of Sargassum and prepare for what’s to come.”

In moderate amounts in the open ocean, Sargassum provides habitat for turtles, invertebrates, fish, and birds, and adds oxygen to the water through photosynthesis. But too much of it near shore can tangle and suffocate marine life, and mats that sink can smother corals and seagrasses. On beaches, decomposing Sargassum releases hydrogen sulfide, a rotten-egg-smelling gas that’s a potential problem for both ecosystems and tourism.

The map above shows Sargassum density in the tropical Atlantic Ocean in June 2026. Red and orange areas are where Sargassum densities were the highest. Note that although the “belt” appears continuous, discrete Sargassum mats are scattered across the ocean surface. The map is based on satellite measurements of how much of the ocean surface was covered by the seaweed, averaged per pixel across all observations made in June by the OCI (Ocean Color Instrument) on NASA’s PACE (Plankton, Aerosol, Cloud, ocean Ecosystem) satellite.
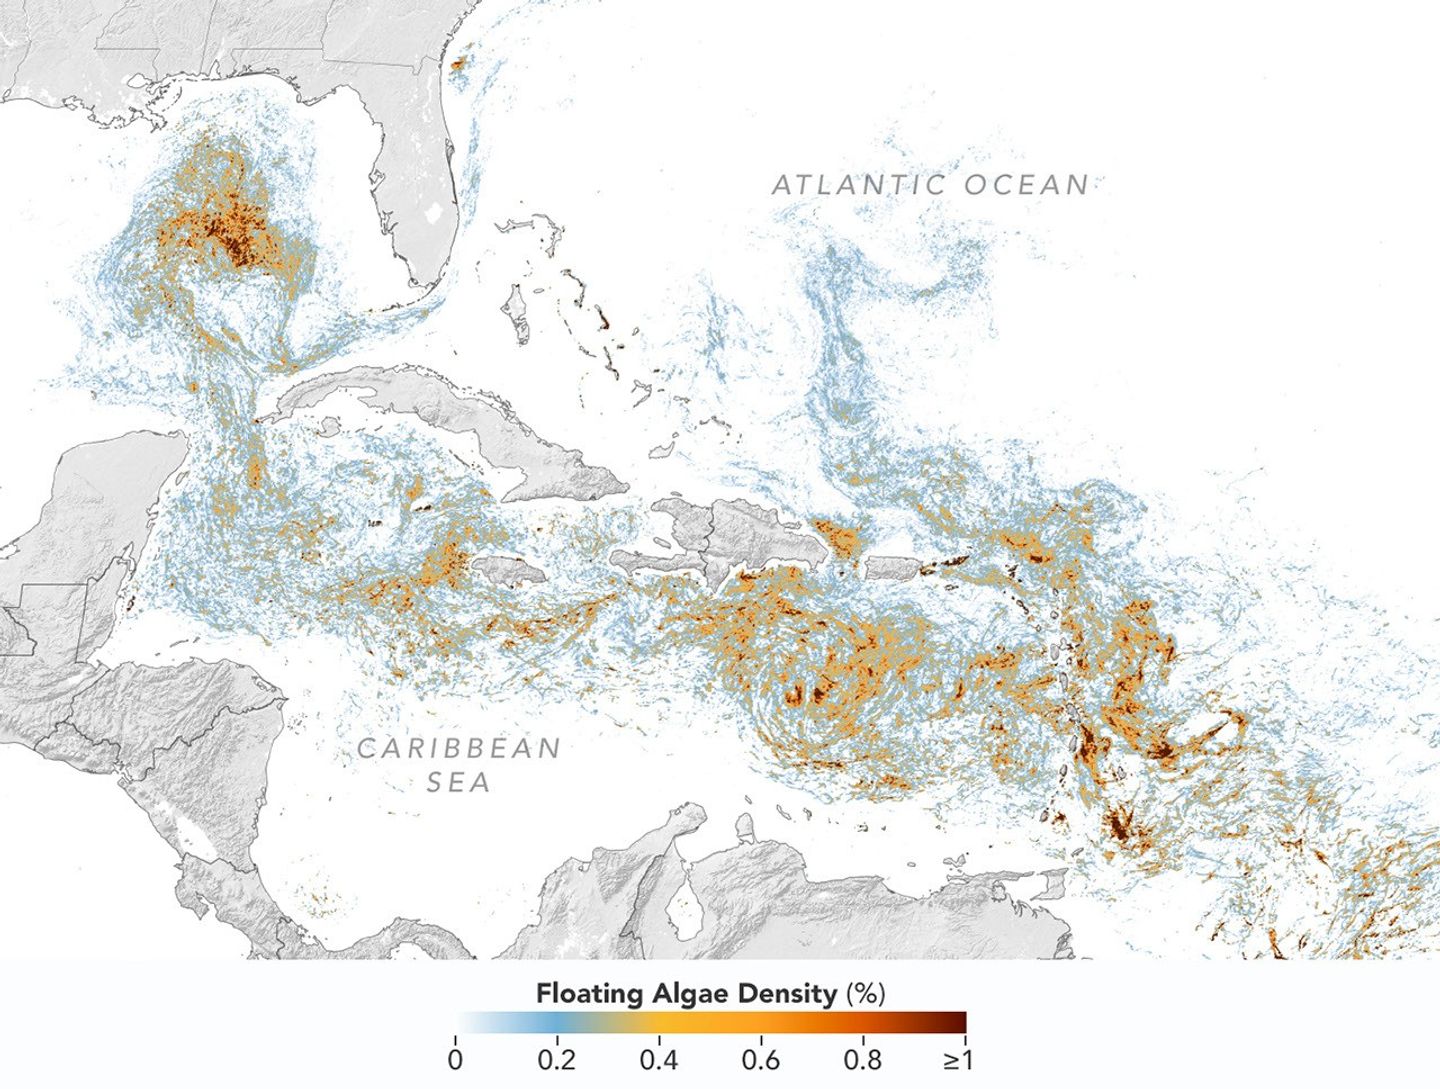
A detailed map of the Atlantic Ocean centered on the Caribbean Sea shows Sargassum density from low (blue) to high (red) in June 2026.
This detailed view of the same PACE OCI map highlights Sargassum concentrations across the Caribbean Sea and Gulf of America, both of which saw record-high amounts of the floating algae in June 2026.
NASA Earth Observatory/Lauren Dauphin

Ocean currents and winds shape the Sargassum belt, which, despite the patchiness, stretches nearly continuously from West Africa to the Gulf and holds a fairly steady “width” from the western tropical Atlantic westward, explained Chuanmin Hu, also an optical oceanographer at USF. The ocean currents have also spared Florida’s west coast from inundation this summer, while delivering large amounts of seaweed to the Florida Keys and the state’s east coast. The bulk of the Sargassum, however, is visible in the Caribbean Sea, shown in detail above, where problems associated with inundation have been more severe, Hu said.

Data for the maps were provided by Lin Qi, an oceanographer at NOAA’s Center for Satellite Applications and Research, who has been working to generate Sargassum maps based on data from PACE, which was launched in February 2024. The work extends that of Qi and colleagues at USF’s Optical Oceanography Laboratory. This team first developed Sargassum detection techniques using MODIS (Moderate Resolution Imaging Spectroradiometer) on NASA’s long-running Terra and Aqua satellites and VIIRS (Visible Infrared Imaging Radiometer Suite) on the NOAA-20 satellite—data that have been a key component of USF’s Sargassum Watch System and of research into the seaweed’s longer-term trends.

Satellites detect Sargassum by its signals in reflected sunlight. Because of its plant structure and chlorophyll pigments, Sargassum reflects more near-infrared light than water. Scientists flag pixels where the reflectance spikes above the levels produced by plain seawater, and then they use the strength of this spike to estimate Sargassum density, which refers to the fraction of ocean surface covered by the seaweed in each pixel. Density estimates can then be converted into biomass, or the total weight of Sargassum present within a pixel, which is how the longer-term trends in the chart below are tracked.
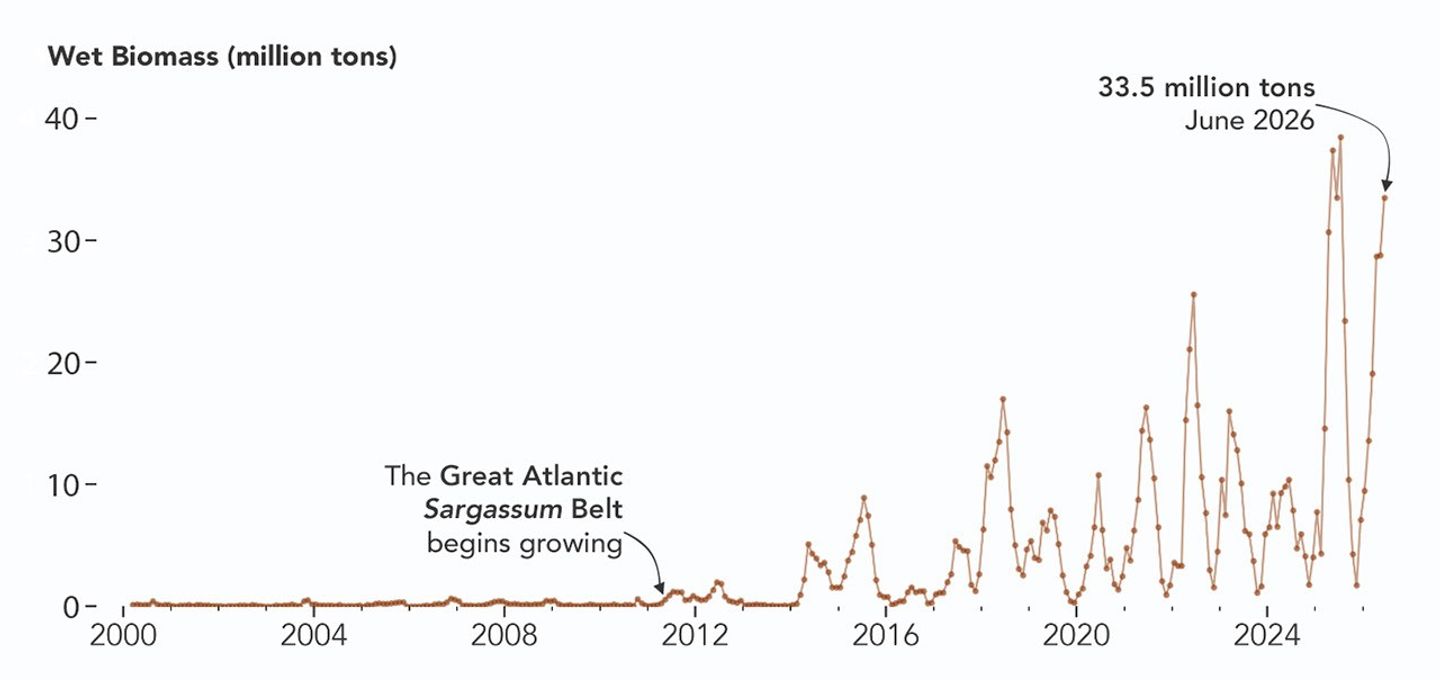
A chart of Sargassum biomass detected by MODIS since the early 2000s, showing amounts increasing beginning in 2011, with progressively higher spikes through summer 2025 and 2026.
NASA Earth Observatory/Lauren Dauphin

The chart above uses the continuous MODIS record since March 2000 to show how Sargassum biomass across the Great Atlantic Sargassum Belt has changed through June 2026. Notice the uptick beginning around 2011, when the belt was first developing, and the seasonal dips in winter and peaks in spring and summer. The record high in July 2025 stands out, followed by the quick rise in early 2026—especially in the first four months of the year—that culminated in the year’s peak in June. More recent observations, not yet reflected in the chart, indicate Sargassum biomass declined through the following month of July.

“Since the initial appearance of the Great Atlantic Sargassum Belt in 2011, the total Sargassum amount in the Atlantic Ocean has increased substantially, more than doubling every five years,” Hu said. He added that the exact mechanism is still being investigated, but it’s possibly related to ocean warming, multiple nutrient sources, and the fact that large Sargassum mats attract other organisms—such as nitrogen-fixing bacteria—that can supply additional nutrients to sustain further growth.

Alongside data from MODIS and VIIRS, OCI data from PACE now feeds into the Sargassum Watch System’s near-real-time daily and weekly composite maps. A recent study of the central-west Atlantic led by Qi, spanning May through August 2024, found that OCI offers several advantages over its predecessors, observing more of the ocean and detecting Sargassum with greater sensitivity.  

Hu noted that the added pixels from OCI can improve near-real-time monitoring and analyses of short-term fluctuations. And its higher sensitivity, he said, will also lead to improved maps during winter months, “thus helping understand Sargassum changes over time.”

Additionally, the study’s authors found that OCI’s hyperspectral capability makes it the only sensor able to spectrally discriminate Sargassum pixels across the Atlantic Ocean “without ambiguity,” adding confidence to the interpretation of detected image features—especially in parts of the Atlantic where another type of floating algae, Trichodesmium, has been reported.

“I think I can speak for all project members, past and present, in sharing how rewarding it is to see the promise of PACE’s advancements come to life,” said Jeremy Werdell, PACE project scientist at NASA’s Goddard Space Flight Center. “OCI has started a true renaissance in aquatic ecosystem monitoring from space.”

NASA Earth Observatory maps and chart by Lauren Dauphin, using PACE and MODIS data courtesy of Lin Qi (NOAA), and Brian Barnes and Chuanmin Hu (University of South Florida, Optical Oceanography Laboratory). Story by Kathryn Hansen.
Downloads

Map of the Atlantic Ocean showing Sargassum density from low (blue) to high (red) in June 2026, with the highest concentrations in the tropical Atlantic.

June 2026

JPEG (2.43 MB)

References & Resources

You may also be interested in:

Stay up-to-date with the latest content from NASA as we explore the universe and discover more about our home planet.
Color Off the Mid-Atlantic Coast

4 min read

Something is brewing in shallow waters offshore of Delaware, New Jersey, Maryland, and Virginia.

Article

A Turquoise Tint for the Black Sea

3 min read

Phytoplankton added a milky blue hue to the waters of the Black Sea and nearby waterways in spring and summer…
Article

El Niño Is Underway

4 min read

Satellite observations of sea surface height indicated that the 2026 event continued to strengthen in early June.

Article
  •  

Calzadas elevadas que parecen no conducir a ninguna parte encontradas en el fuerte de la Edad del Hierro en el oeste de Inglaterra

Un equipo de arqueólogos y estudiantes de la Universidad de Birmingham ha iniciado los primeros trabajos de excavación en el yacimiento conocido como Wall Camp, un fuerte de la Edad del Hierro situado en la llanura de Shropshire al oeste de Inglaterra, que no había sido objeto de intervención arqueológica desde la década de 1980. […]

  •  

Satélite Sentinel-1A diz adeus depois de mais de uma década a vigiar a Terra. Legado continua em órbita

Ao longo da missão, o Sentinel-1A registou milhões de imagens usadas para monitorizar cheias, incêndios, gelo marinho, culturas agrícolas, infraestruturas, tráfego marítimo e operações de resposta a catástrofes.

The post Satélite Sentinel-1A diz adeus depois de mais de uma década a vigiar a Terra. Legado continua em órbita appeared first on Tek Notícias.

  •  

Pluto’s Moon Charon May Still Be Slowing Its Spin, Study Suggests

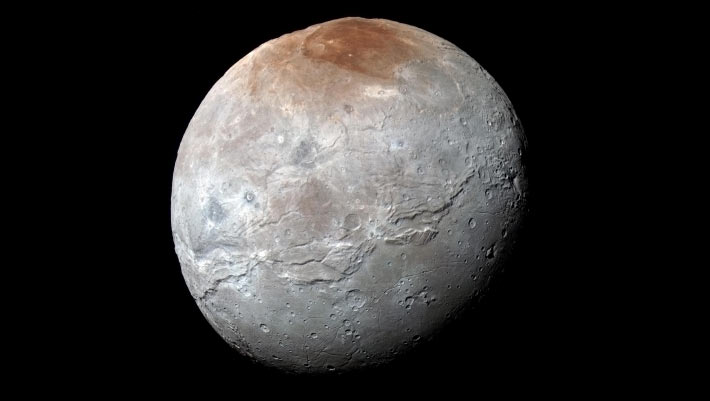
This impressive view of Charon was captured on July 14, 2015. Charon’s color palette is not as diverse as Pluto’s; most striking is the reddish north (top) polar region, informally named Mordor Macula. Image credit: NASA / Johns Hopkins University Applied Physics Laboratory / Southwest Research Institute.

New research indicates that Pluto’s largest moon, Charon, may continue to lose rotational energy despite the pair’s long-standing tidal lock, offering scientists a rare glimpse into the hidden interiors of distant icy worlds.

The post Pluto’s Moon Charon May Still Be Slowing Its Spin, Study Suggests appeared first on Sci.News: Breaking Science News.

  •  

Montagne asimmetriche nella regione equatoriale di Oz Terra, lunghe oltre 2…

Montagne asimmetriche nella regione equatoriale di Oz Terra, lunghe oltre 200 chilometri, e faglie orientate lungo precise direttrici polari. È la firma geologica che il rallentamento della rotazione impresso dalle forze mareali (un processo noto come despinning) ha inciso sulla crosta ghiacciata di Caronte, la luna più grande di Plutone. Il geologo planetario Hanzhang Chen, […]
  •  

Ariane 6 dá “boleia” a 36 satélites da Amazon e bate recorde europeu na capacidade de lançamento

Marcando o oitavo voo consecutivo realizado com sucesso, o foguetão Ariane 6 colocou em órbita 36 satélites da constelação Leo da Amazon, aproveitando para bater o recorde europeu do voo mais “poderoso” de sempre.

The post Ariane 6 dá “boleia” a 36 satélites da Amazon e bate recorde europeu na capacidade de lançamento appeared first on Tek Notícias.

  •  

Tropical Storm Arthur

Natural color
brightness temperature
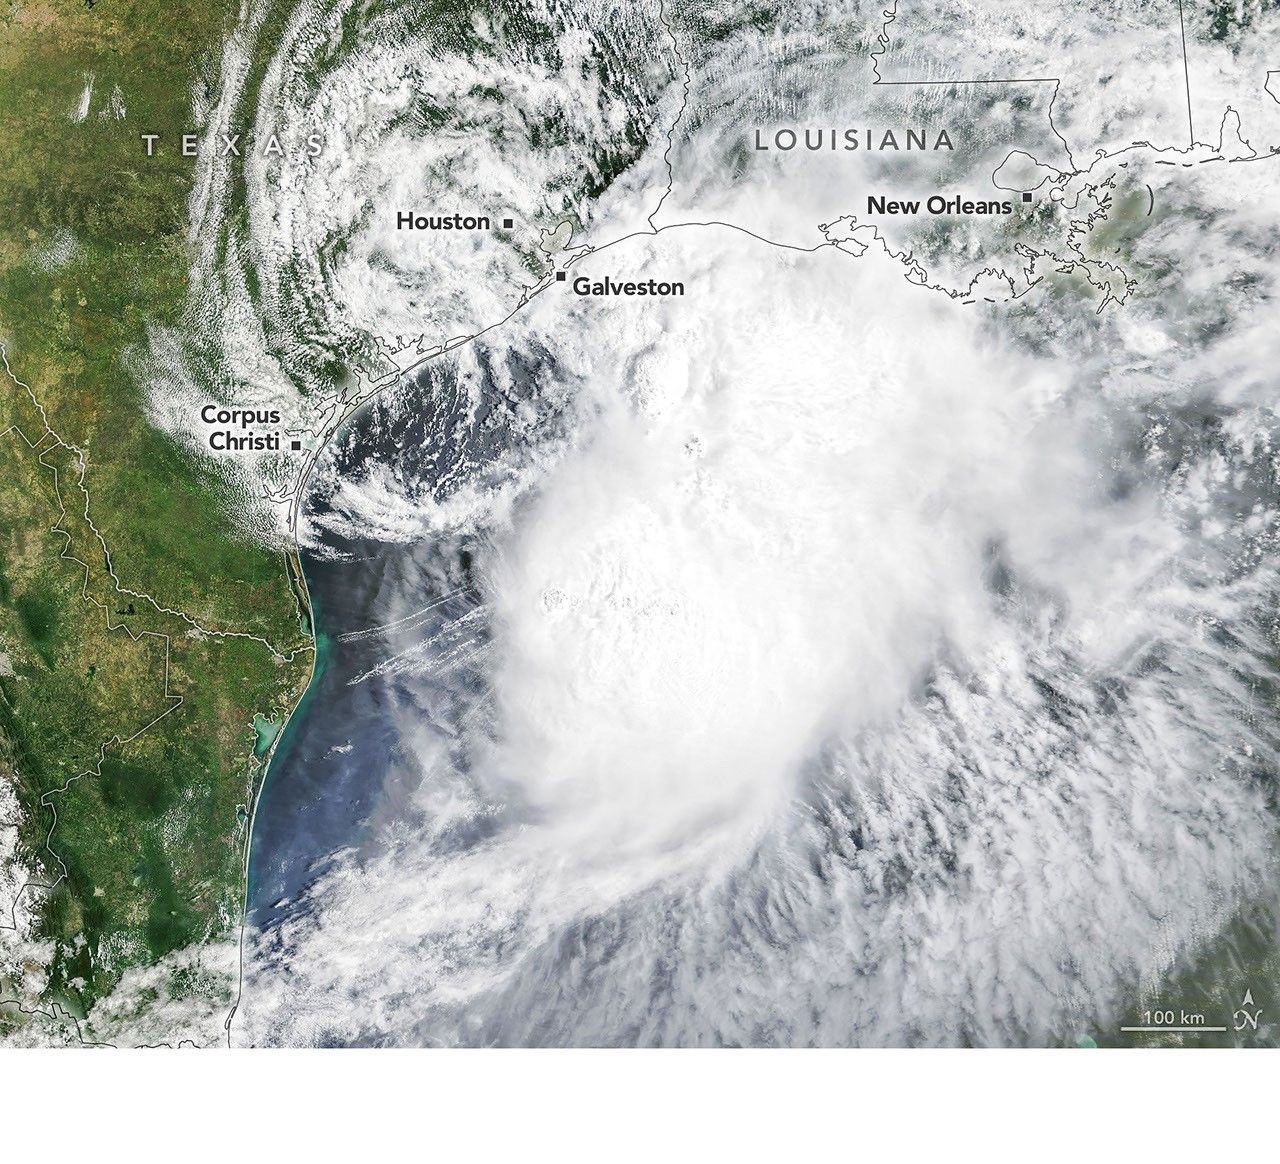
Tropical Storm Arthur’s white storm clouds cover the waters off the U.S. Gulf Coast. Some clouds extend inland over parts of Texas and Louisiana.
NASA Earth Observatory/Michala Garrison
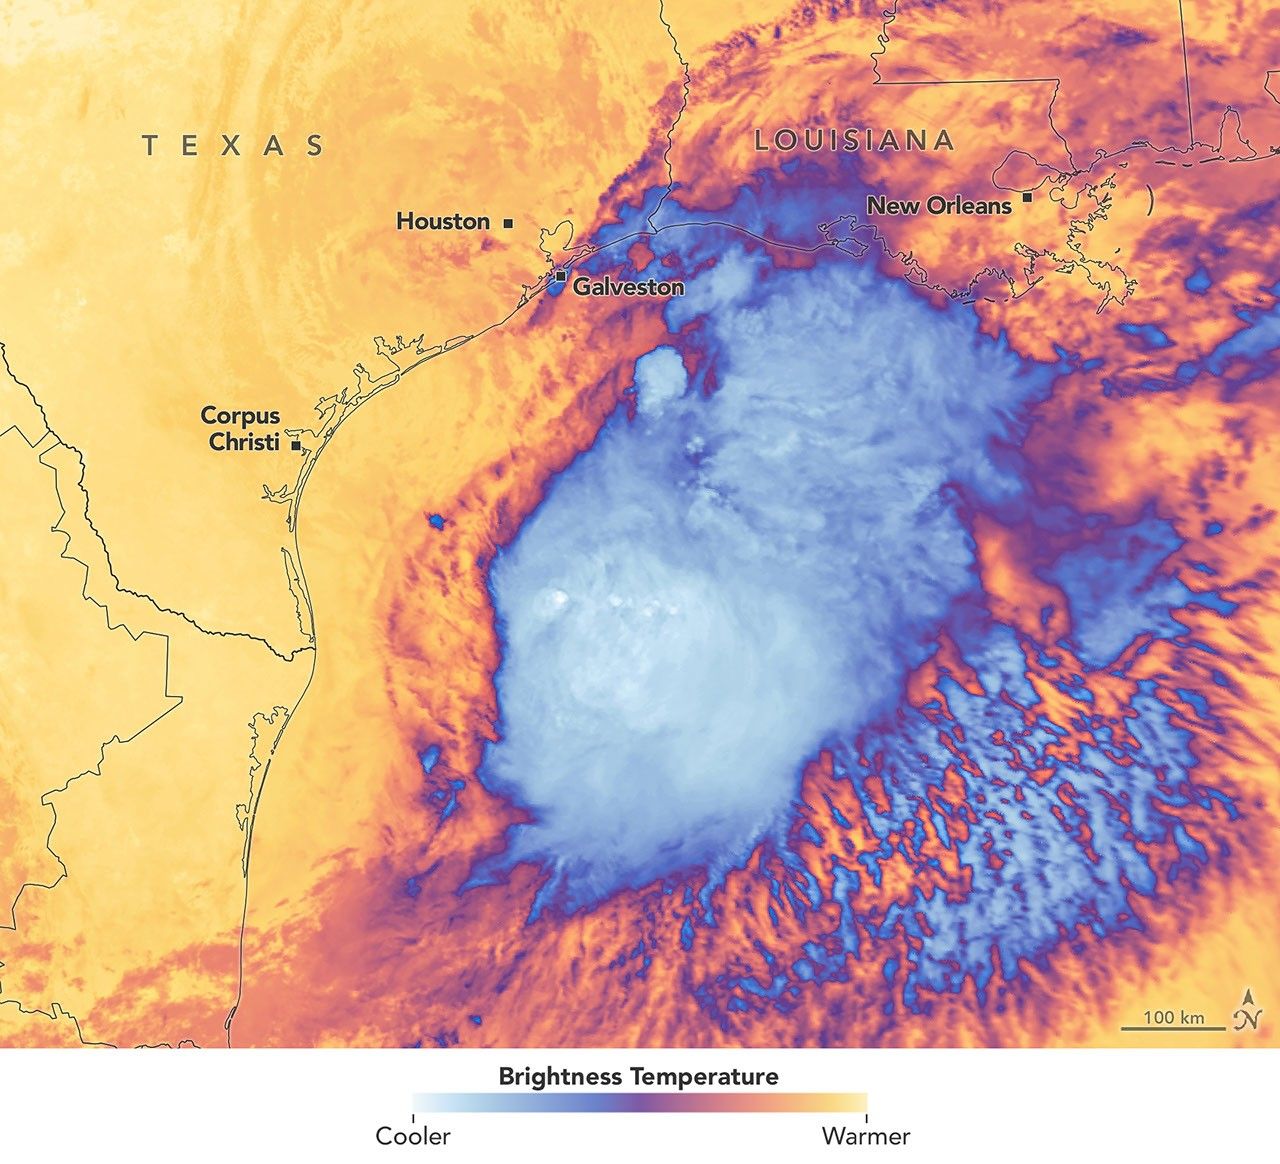
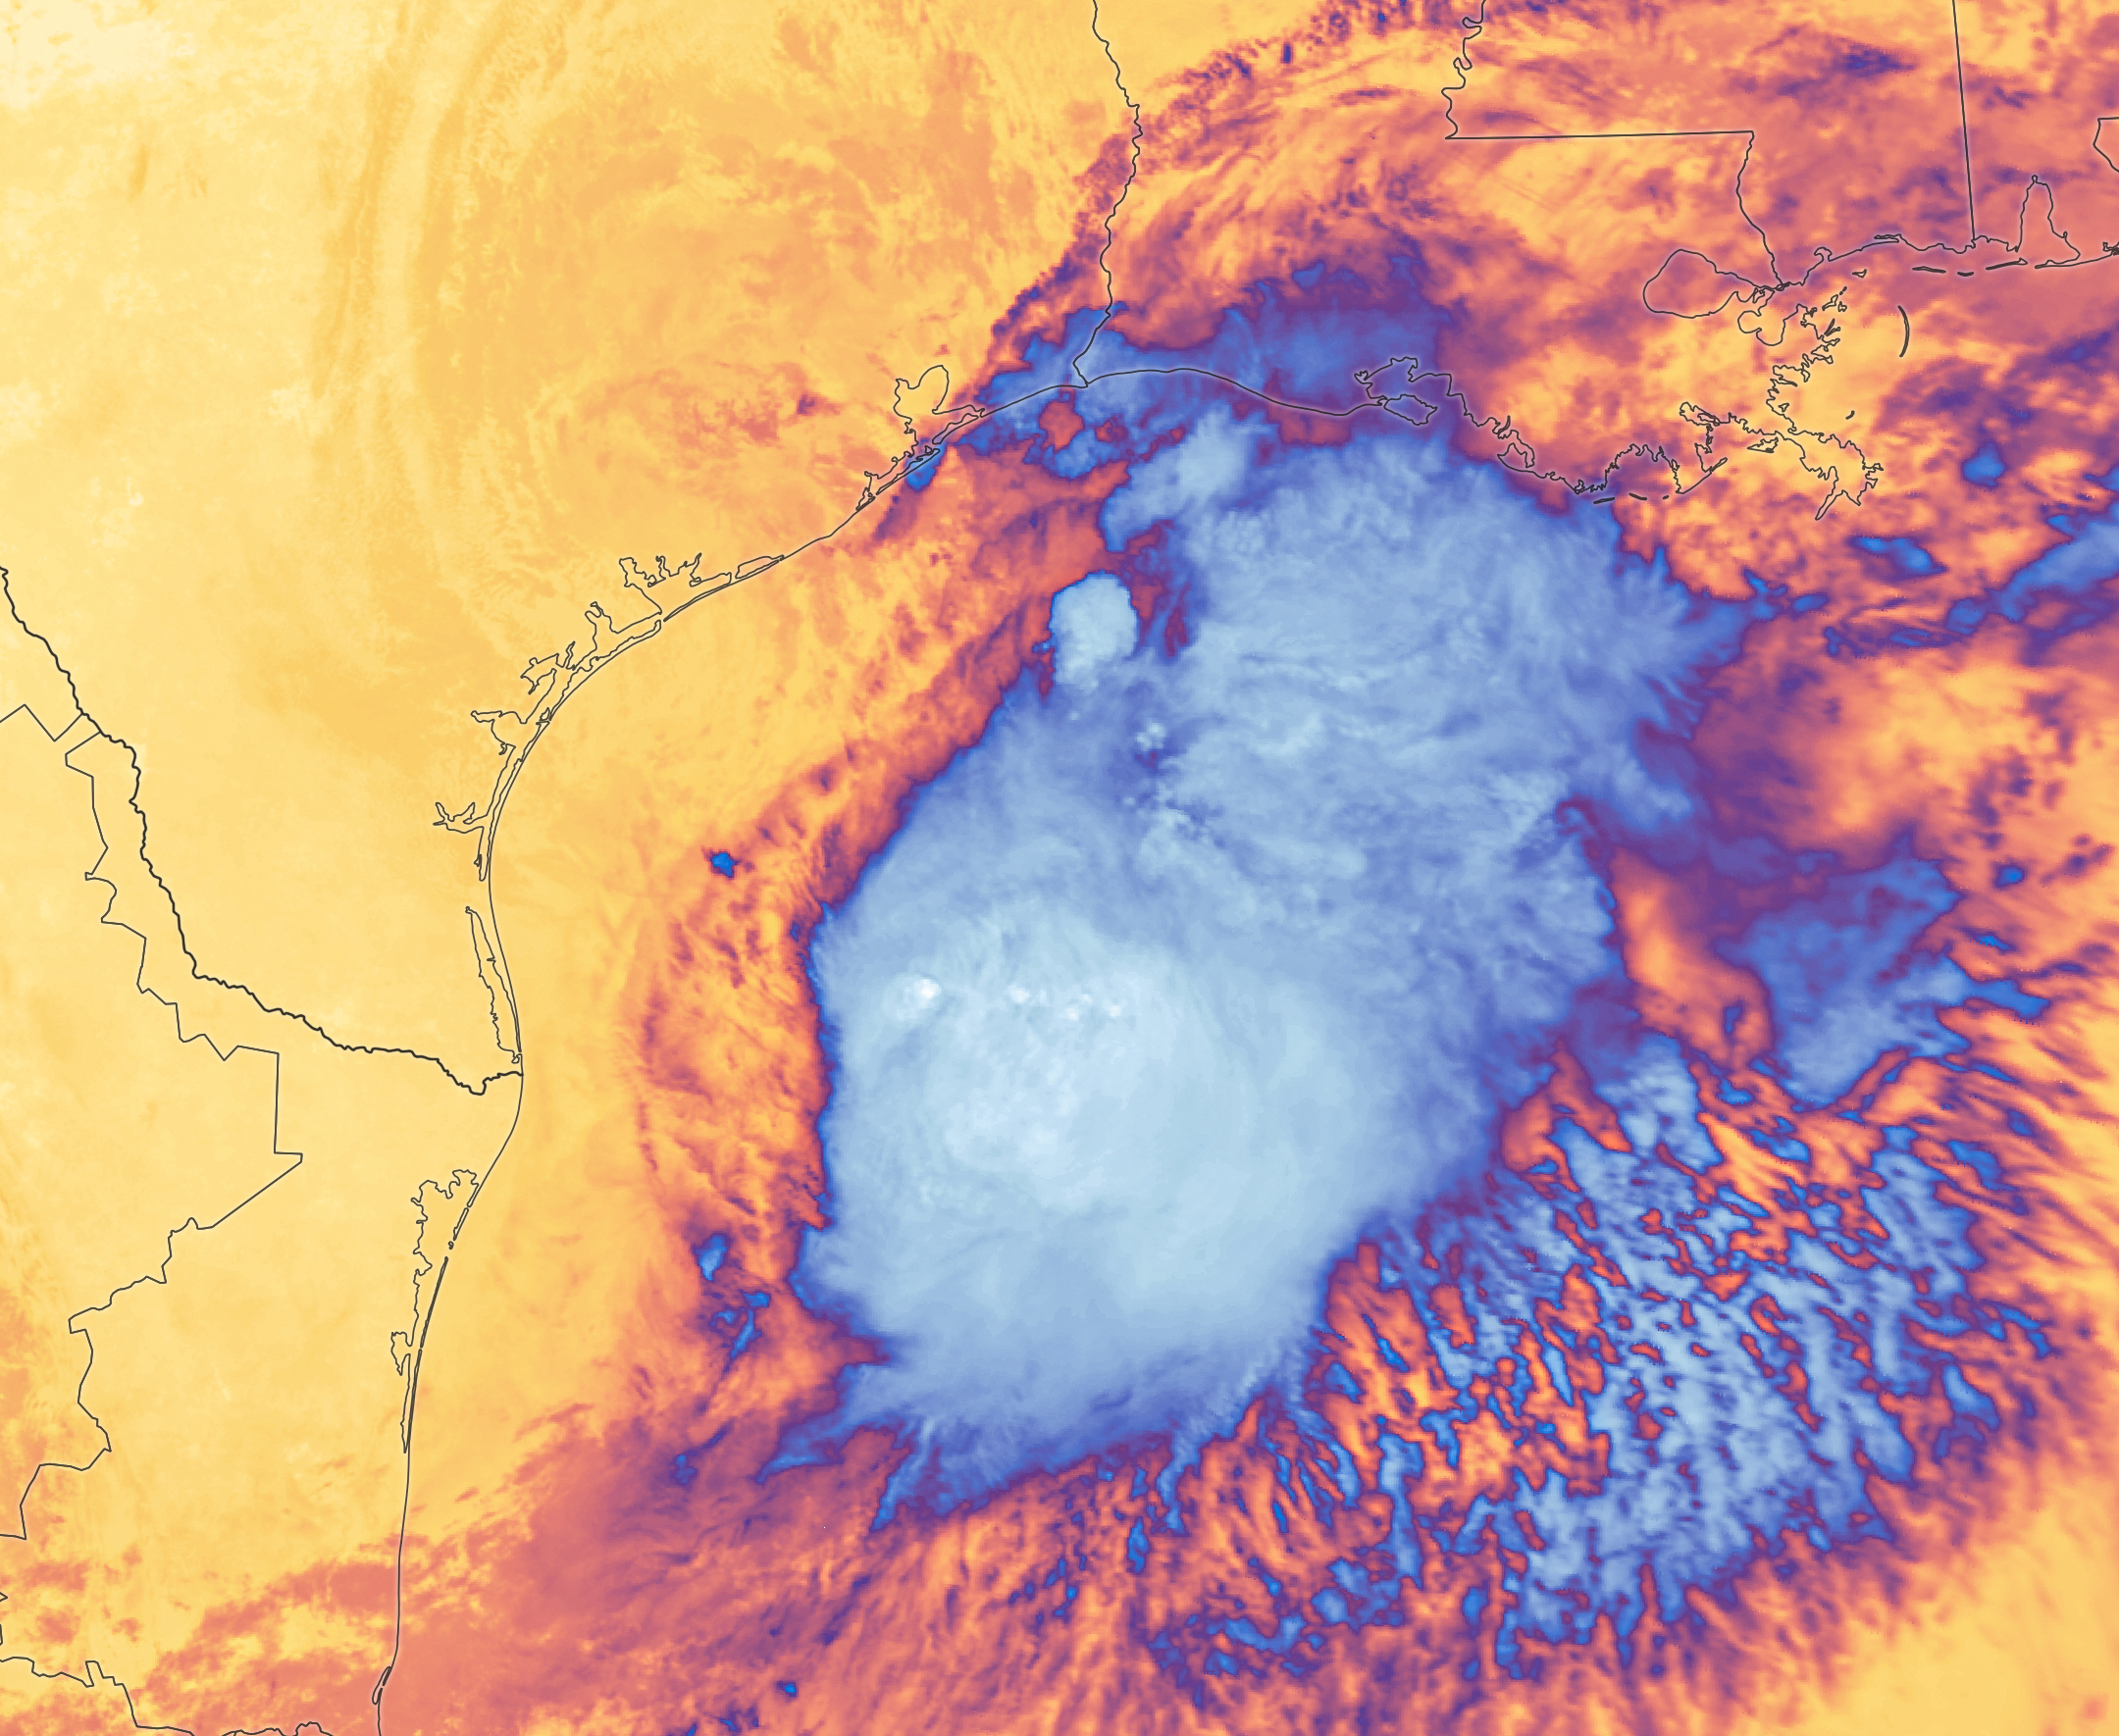
White and purple areas of cloud off the Gulf Coast indicate the cooler areas of cloud tops associated with Tropical Storm Arthur.
NASA Earth Observatory/Michala Garrison
Natural color
brightness temperature
Images from the MODIS (Moderate Resolution Imaging Spectroradiometer) on NASA’s Terra satellite show Tropical Storm Arthur on the morning of June 17, 2026. The left image is natural color; the right shows infrared signals known as brightness temperature. NASA Earth Observatory images by Michala Garrison.

Tropical Storm Arthur, the first named storm of the 2026 Atlantic hurricane season, brought high winds and heavy rain to the U.S. Gulf Coast in mid-June.

NASA’s Terra satellite captured this natural-color image (left) at 10:30 a.m. Central Time (15:30 Universal Time) on June 17. The second image (right) depicts infrared signals known as brightness temperature, which help distinguish cooler cloud tops (white and purple) from the warmer surface below (yellow and orange). Around the time these images were acquired, the system had just recently been designated a tropical storm, according to the National Hurricane Center (NHC).

Though Arthur stayed below hurricane strength, it still delivered strong winds to parts of the Gulf Coast as it tracked northeast. The storm had maximum sustained winds of 40 miles (65 kilometers) per hour around the time these images were captured. Tropical-storm-force winds extended 175 miles (280 kilometers) from the storm’s center, the NHC reported. Measurements at Galveston, Texas, for instance, showed a gust of 48 miles per hour.

The storm also produced heavy rainfall that the National Weather Service warned could lead to life-threatening flash flooding. Estimates from IMERG (the Integrated Multi-Satellite Retrievals for GPM), a product of the GPM (Global Precipitation Measurement) mission, showed high rainfall rates over Gulf waters and extending inland on June 17.

As Arthur weakened and became less organized, it continued to bring abundant moisture to central Gulf Coast states on June 18. The National Weather Service reported rainfall rates of 3 inches (7.6 centimeters) per hour in southeastern Louisiana. Forecasts indicated that storm-total rainfall amounts could exceed 12 inches (30 centimeters) in areas, with some locations seeing totals approaching 20 inches (51 centimeters).

NASA Earth Observatory images by Michala Garrison, using MODIS data from NASA EOSDIS LANCE and GIBS/Worldview. Story by Kathryn Hansen.

Downloads

Tropical Storm Arthur’s white storm clouds cover the waters off the U.S. Gulf Coast. Some clouds extend inland over parts of Texas and Louisiana.

June 17, 2026: Natural color

JPEG (2.94 MB)

White and purple areas of cloud off the Gulf Coast indicate the cooler areas of cloud tops associated with Tropical Storm Arthur.

June 17, 2026: Brightness temperature

JPEG (2.51 MB)

References & Resources

You may also be interested in:

Stay up-to-date with the latest content from NASA as we explore the universe and discover more about our home planet.

Typhoon Jangmi
2 min read

The sprawling storm promised to deliver torrential rain across a wide swath of southern Japan.

Article
Tropical Cyclone Narelle Crosses Australia
3 min read

The powerful storm lashed the northern edge of the continent with damaging winds and drenching rain as it made landfall…

Article
Super Typhoon Sinlaku
3 min read

The violent storm aimed at the U.S. Northern Mariana Islands and Guam in mid-April 2026.

Article

The post Tropical Storm Arthur appeared first on NASA Science.

  •  

Medir ventos estranhos deu pistas sobre exoplanetas onde pode vir a ser possível viver

Pela primeira vez, cientistas compararam ambientes magnéticos de outros planetas, um passo fundamental para compreender aqueles que podem ser habitáveis, conservar água e, talvez, um dia, albergar vida tal como a conhecemos - e criar auroras ainda mais espetaculares.

The post Medir ventos estranhos deu pistas sobre exoplanetas onde pode vir a ser possível viver appeared first on Tek Notícias.

  •  

Bola de fogo atravessa céus nos Estados Unidos com estrondo massivo. NASA confirma explosão de meteoro

Um meteoro explodiu na costa de Massachusetts, nos Estados Unidos, provocando um estrondo sentido em vários estados. De acordo com a NASA, a energia libertada foi equivalente a cerca de 300 toneladas de dinamite. 

The post Bola de fogo atravessa céus nos Estados Unidos com estrondo massivo. NASA confirma explosão de meteoro appeared first on Tek Notícias.

  •  

Um pôr do sol impossível, um cometa azul e outras imagens da NASA para descobrir em maio

Entre galáxias espirais, auroras verdes e novas vistas infravermelhas da enigmática lua Titã, de Saturno, maio confirmou uma vez mais que a fotografia continua a ser uma das formas mais poderosas de explorar lugares onde, por agora, ainda não podemos chegar.

The post Um pôr do sol impossível, um cometa azul e outras imagens da NASA para descobrir em maio appeared first on Tek Notícias.

  •  
❌