❌

Reading view

Lake sediments trace 16,000 years of Western Balkan summers

Sediments from a small mountain lake in Bosnia and Herzegovina preserve an approximately 16,000-year record of summer temperature change in the Western Balkans, revealing abrupt climatic shifts whose effects varied across Europe. Researchers at Eötvös Loránd University reconstructed past mean July temperatures from chironomid remains and other lake-sediment indicators, then used pollen, sediment particles, organic matter and geochemical elements to track associated changes in vegetation, erosion and lake conditions. Two peer-reviewed studies published in 2026 examine different periods in the same sequence, together covering the Late Glacial, the Holocene and more recent centuries.

The reconstructed record shows that a large cooling event associated with the Younger Dryas lowered estimated mean July temperatures at Lake Prokoško by approximately 2.3°C, a change intermediate between estimates from Alpine lakes and those farther east. The lake, which covers 4.8 hectares at an elevation of 1,670 metres in the Vranica Mountains of the Dinaric Alps, also records a later Middle Holocene interval in which estimated summer temperatures may have exceeded present-day levels. These findings emerge from a paleoclimate reconstruction based on biological, chemical and physical evidence preserved in lake sediments, rather than from direct instrumental measurements.

Lake Prokoško occupies a climatically significant position between Western, Central and Eastern Europe. Over thousands of years, remains from the surrounding landscape and the lake’s own ecosystem accumulated in bottom sediments, providing material for reconstructing regional environmental and climatic history. One study, published in Palaeogeography, Palaeoclimatology, Palaeoecology, focused on rapid changes between approximately 16,000 and 10,000 years ago during the Late Glacial and beginning of the Holocene. A separate study in Quaternary Science Reviews traced conditions through the Holocene to the present, extending the interpretation of the sediment sequence across the full period represented by the two investigations.

Chironomids, a group of aquatic insects also known as non-biting midges, supplied the principal temperature indicator. Their larvae occupy lake sediments and differ in their preferences for water temperature, oxygen levels and nutrient conditions. After moulting, larvae leave chitinous head capsules that sink to the lake bed, where they can be preserved for tens of thousands of years. The researchers identified the species represented in different sediment layers and compared the fossil assemblages with faunal and climate data from hundreds of modern European lakes. This comparison supported estimates of mean July temperature, while the accompanying pollen, sediment, organic-matter and chemical records provided evidence about forests, soil erosion, lake productivity and other environmental changes.

The oldest layers examined reflect cold conditions near the end of the last glacial period. At around 14,600 years ago, reconstructed mean July temperatures around Lake Prokoško were below 8°C. They subsequently rose by approximately 2.6°C within a comparatively short interval, reaching around 10.2°C. The reconstruction associates this warming with increased biological activity in the lake, spreading vegetation and more stable conditions in the catchment. The youngest sediments in the study cover the most recent millennium, where the chironomid community reflected not only temperature changes but also centuries of alpine grazing, greater nutrient input and the later expansion of nutrient-rich conditions.

The early warming ended abruptly when the Younger Dryas began around 12,900 years ago, the last major cooling episode at the close of the last glacial period. Estimated mean July temperatures at Lake Prokoško fell by approximately 2.3°C to about 7.9°C. Cold-water chironomid species became more abundant, while increased erosion transported more clastic material into the lake. Comparisons with reconstructions elsewhere in Europe revealed a marked spatial contrast: summer cooling of 3–4°C has been reconstructed at many Alpine lakes, whereas decreases in the Eastern and Southern Carpathians were generally less than 1°C. The Lake Prokoško estimate falls between those geographic extremes.

The researchers connect this west-to-east gradient, which becomes weaker toward the east, to oceanic and atmospheric changes in the North Atlantic region. For the Carpathian Basin, the contrast illustrates that the same large-scale climatic event can produce different responses in Western, Central and Eastern Europe. Lake Prokoško consequently provides a regional reference point for examining how the magnitude of a shared climate signal varied geographically. The researchers also emphasize that alpine lakes respond sensitively to relatively small temperature changes: variations in ice-cover duration, water stratification, oxygen content and biological activity can accompany those changes, making small mountain lakes useful environmental archives.

Warming resumed at the end of the Younger Dryas. Between approximately 11,800 and 11,400 years ago, reconstructed mean July temperatures increased by around 2.9°C. By about 10,500 years ago, they may have reached approximately 12.6°C. The lake became more productive, its ice-free season lengthened, and closed-canopy forests developed in the catchment, reducing erosion. Temperatures did not remain constant throughout the Holocene. Around 6,800 years ago, reconstructed mean July temperatures may have reached approximately 14°C, meaning that some summers around Lake Prokoško were warmer than those experienced today. The researchers distinguish this Middle Holocene warmth from present-day warming: the earlier conditions were mainly seasonal and driven by gradual changes in Earth’s orbital parameters that increased Northern Hemisphere summer insolation, whereas current warming is global, year-round, more rapid and primarily associated with human-caused greenhouse gas emissions.

A cooling trend began around 6,000 to 5,500 years ago during the Neoglacial transition toward a cooler Late Holocene. Reconstructed mean July temperatures fell from approximately 14°C to around 12.8°C, then to 11.8°C by about 5,670 years ago. Pollen evidence indicates that people were altering the landscape around the lake by the end of the Neolithic, approximately 6,000 years ago. Plants associated with grazing and open habitats became more common, followed later by more intensive forest use and the expansion of open areas. The same sediment archive therefore records both reconstructed climatic variability and the growing influence of human land use, although it does not by itself establish that human activity caused the temperature changes documented in the sequence.

Later Holocene temperatures continued to vary. Around 3,000 years ago, another significant cooling began, with mean summer temperatures falling from approximately 14.7°C to 12°C. Around 2,000 years ago, reconstructed temperatures rose during the Roman Warm Period, reaching approximately 13.3°C. Over the past millennium, centuries of alpine grazing opened the surrounding landscape and increased the nutrient load entering Lake Prokoško. The chironomid community changed significantly around 700 years ago, and species preferring more nutrient-rich waters became increasingly common over the following 500 years. Together, the two studies show that the lake’s fossil and sediment record captures environmental responses shaped by both regional climate change and local human transformation, while also demonstrating that estimates for individual periods remain reconstructions derived from sediment proxies and modern comparative data.

Subject of Research: Paleoclimate reconstruction of summer temperature variability in the Western Balkans

Article Title: Where three climate zones meet

Article References: Where three climate zones meet. Original publication (Bibliographic details unavailable.)

Image Credits: AI Generated

DOI: Not provided

Keywords: Lake Prokoško, Western Balkans, summer temperatures, paleoclimate, chironomid fossils, Younger Dryas, Holocene, climate reconstruction, land use, alpine lake, three, climate

  •  

« Ce typhon est l’un des plus parfaits qu’il m’ait été donné de voir » : les images de Champi sont terrifiantes

Un œil sombre, parfaitement circulaire, cerné par une spirale nuageuse d’une régularité troublante : le supertyphon Champi offre aux satellites une image presque irréelle. Derrière cette beauté se cache une machine atmosphérique d’une efficacité redoutable et une évolution rapide que les...

  •  

Summer Goes Out With a Heat Dome

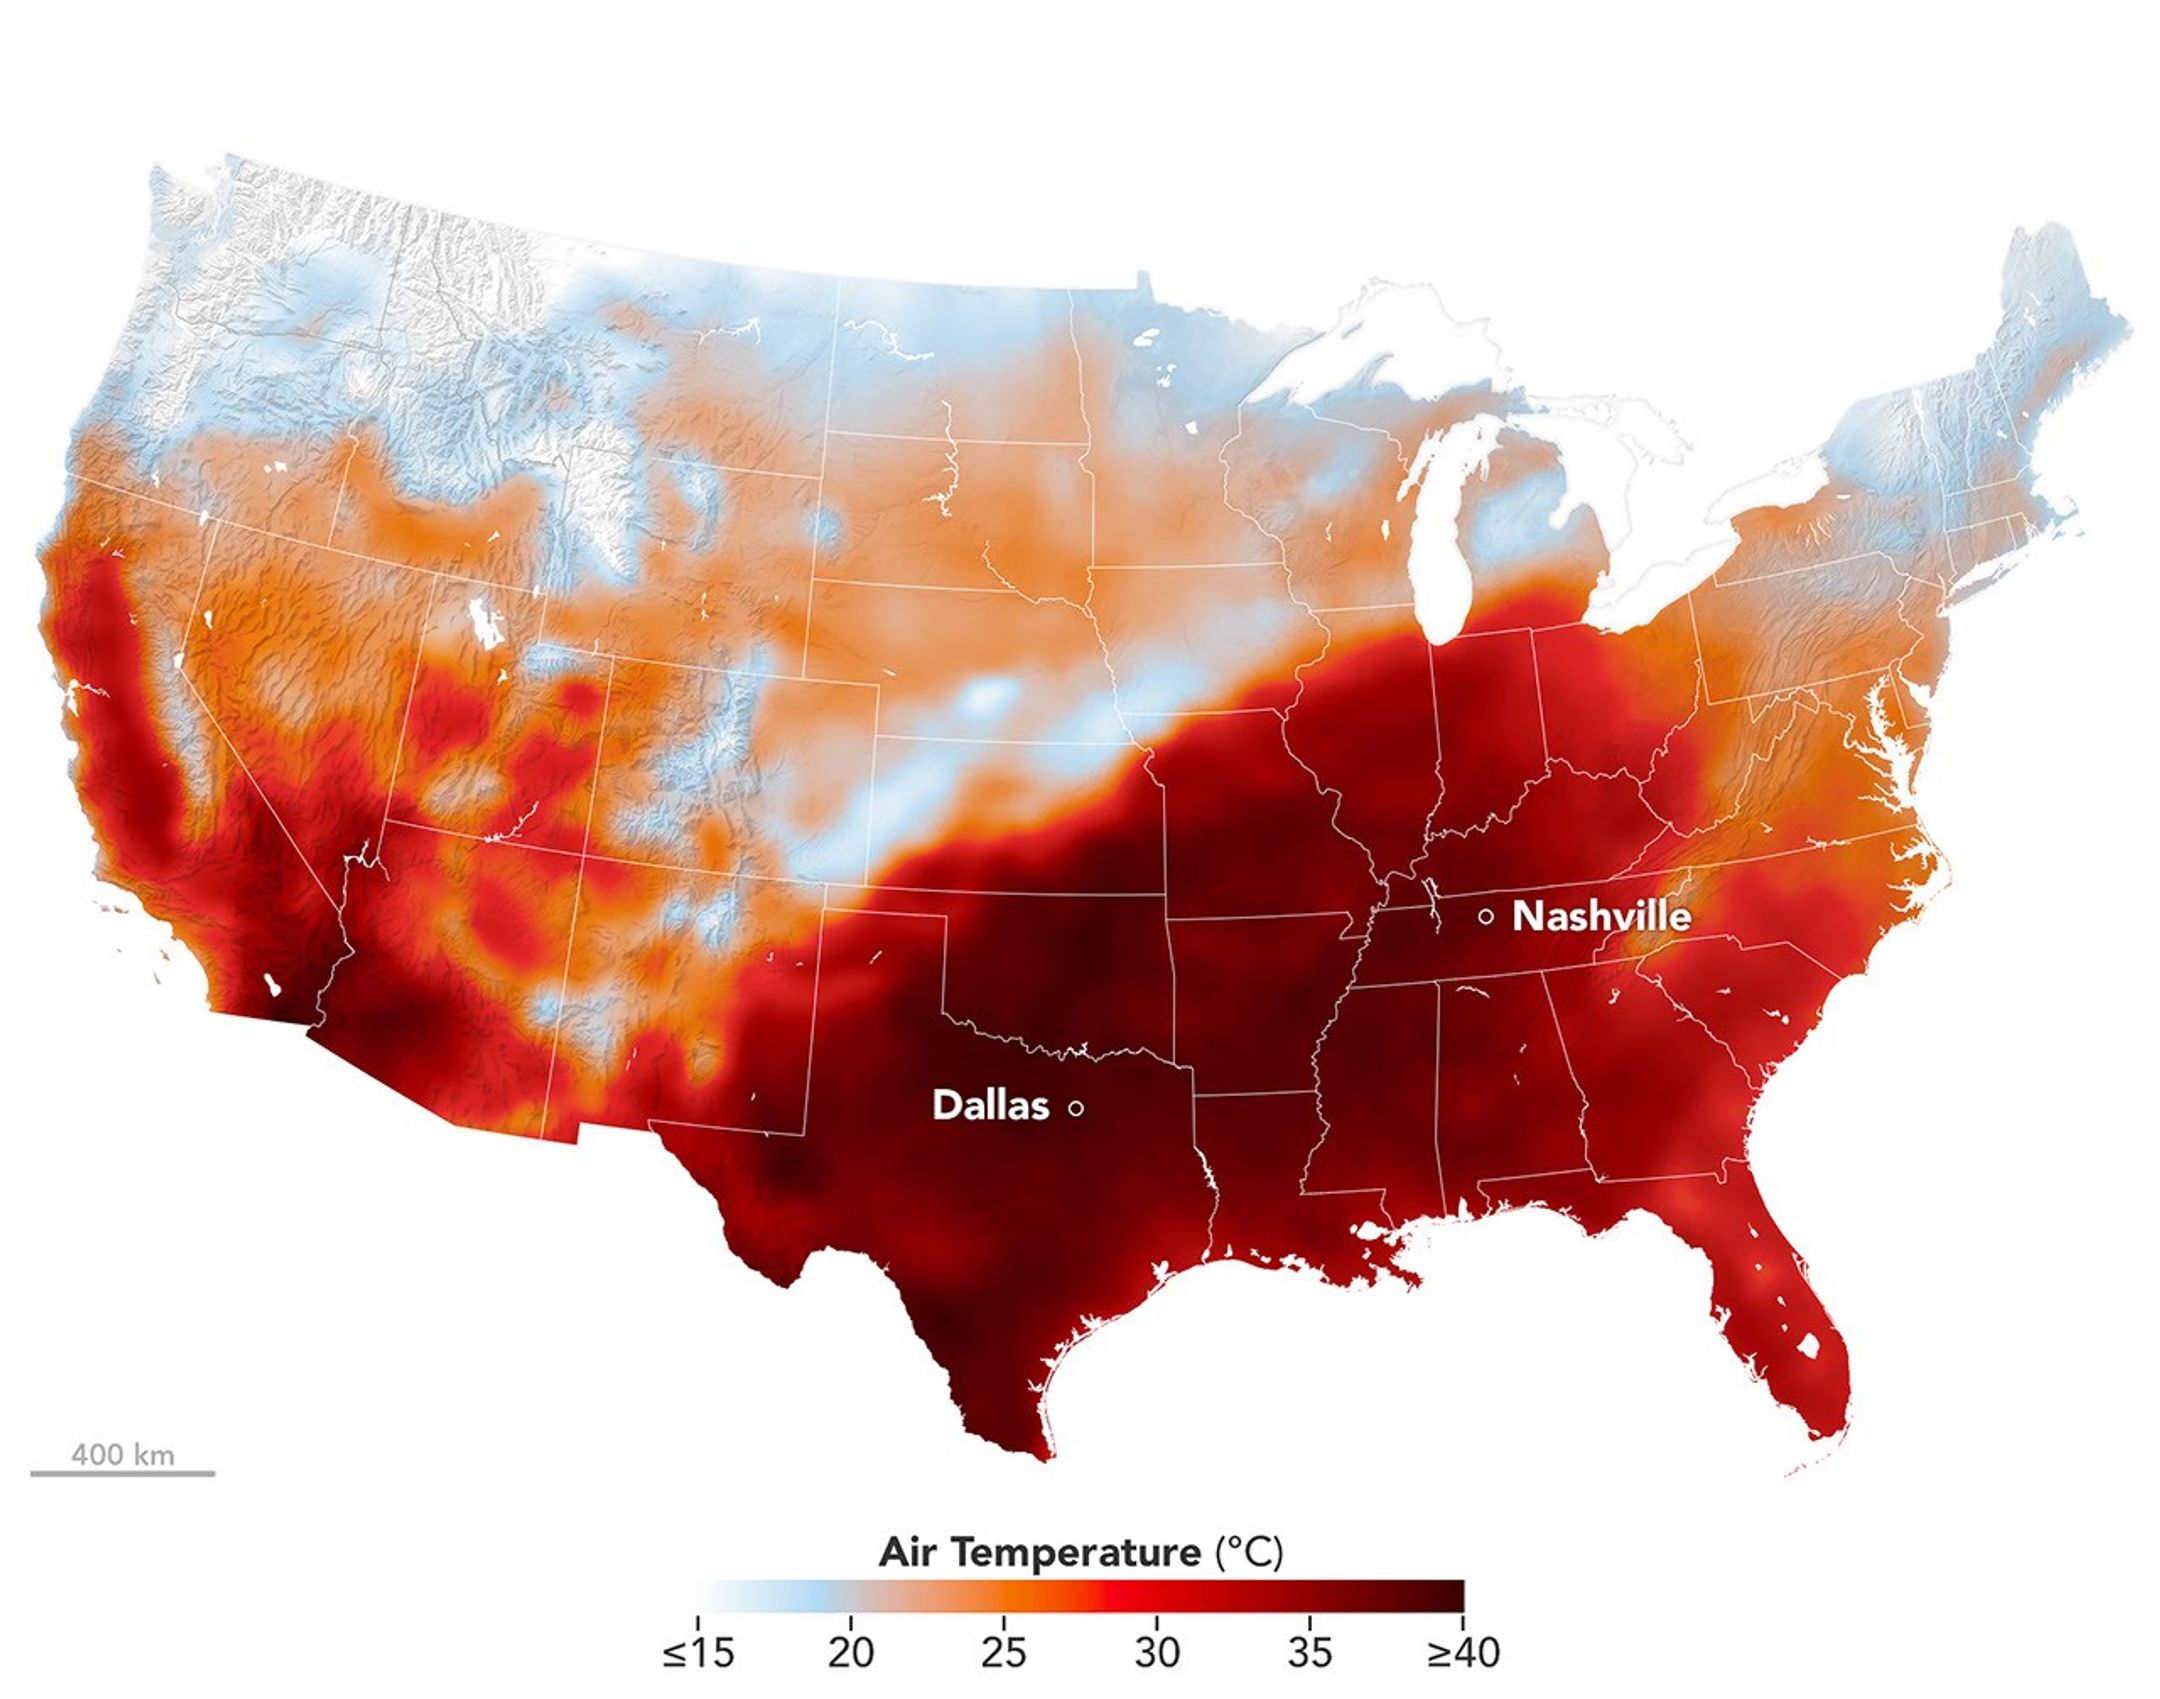
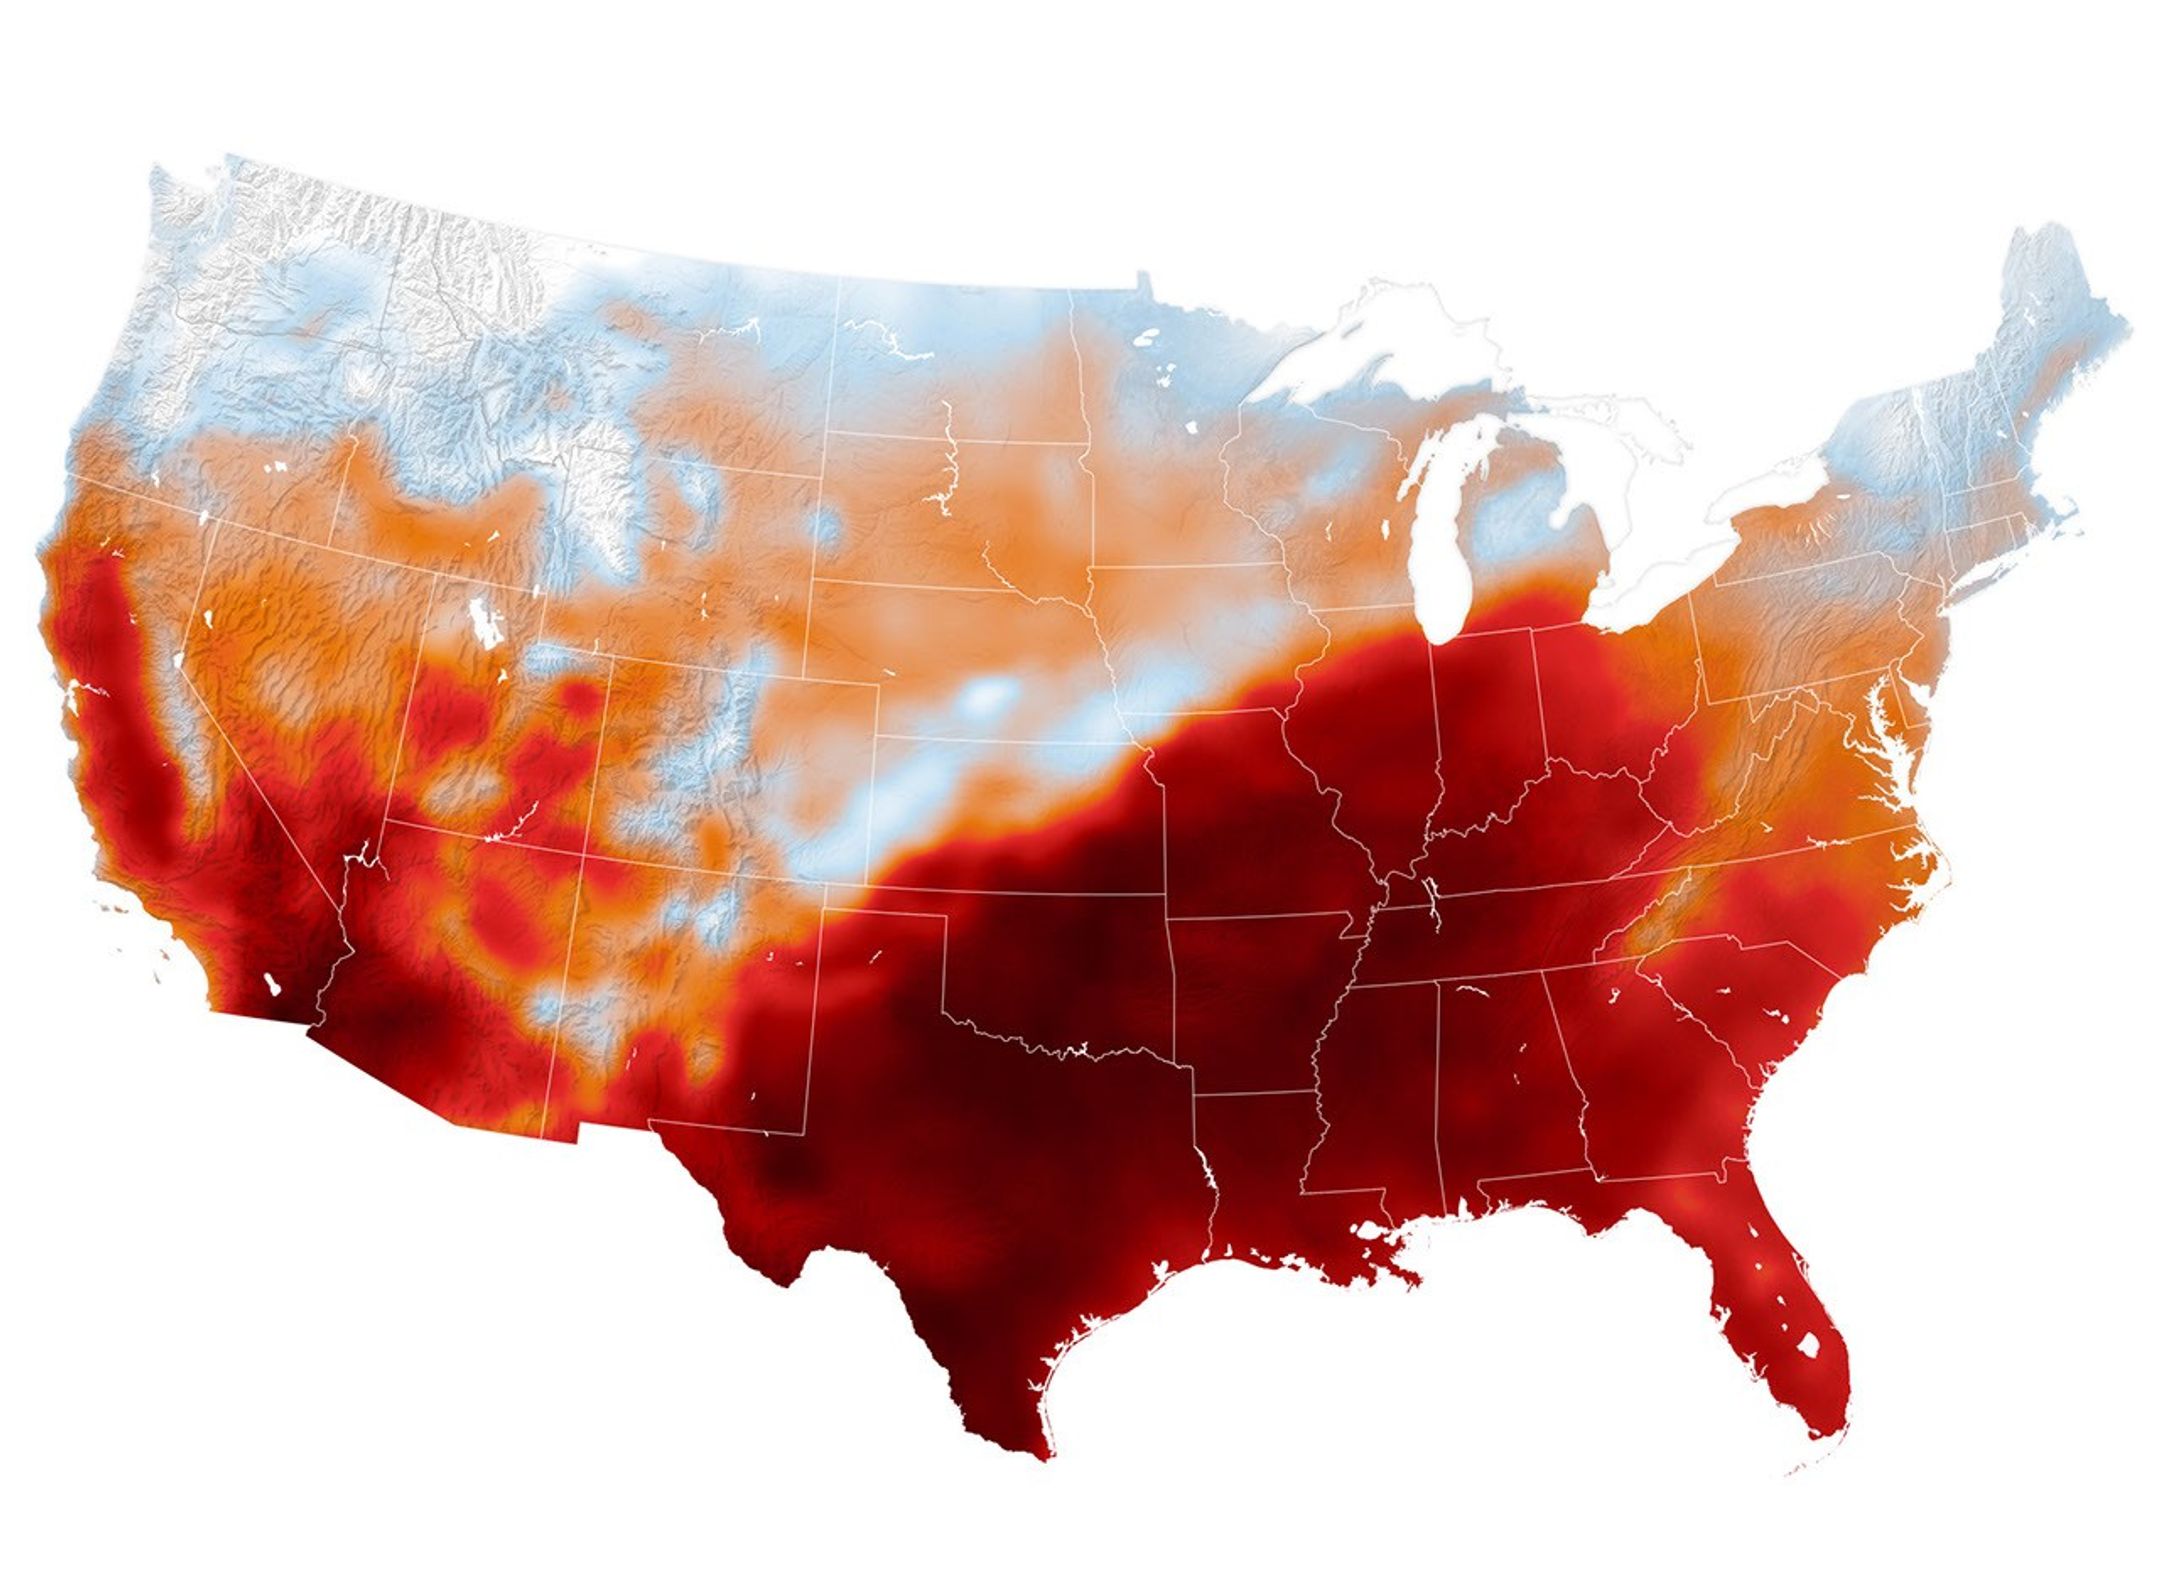
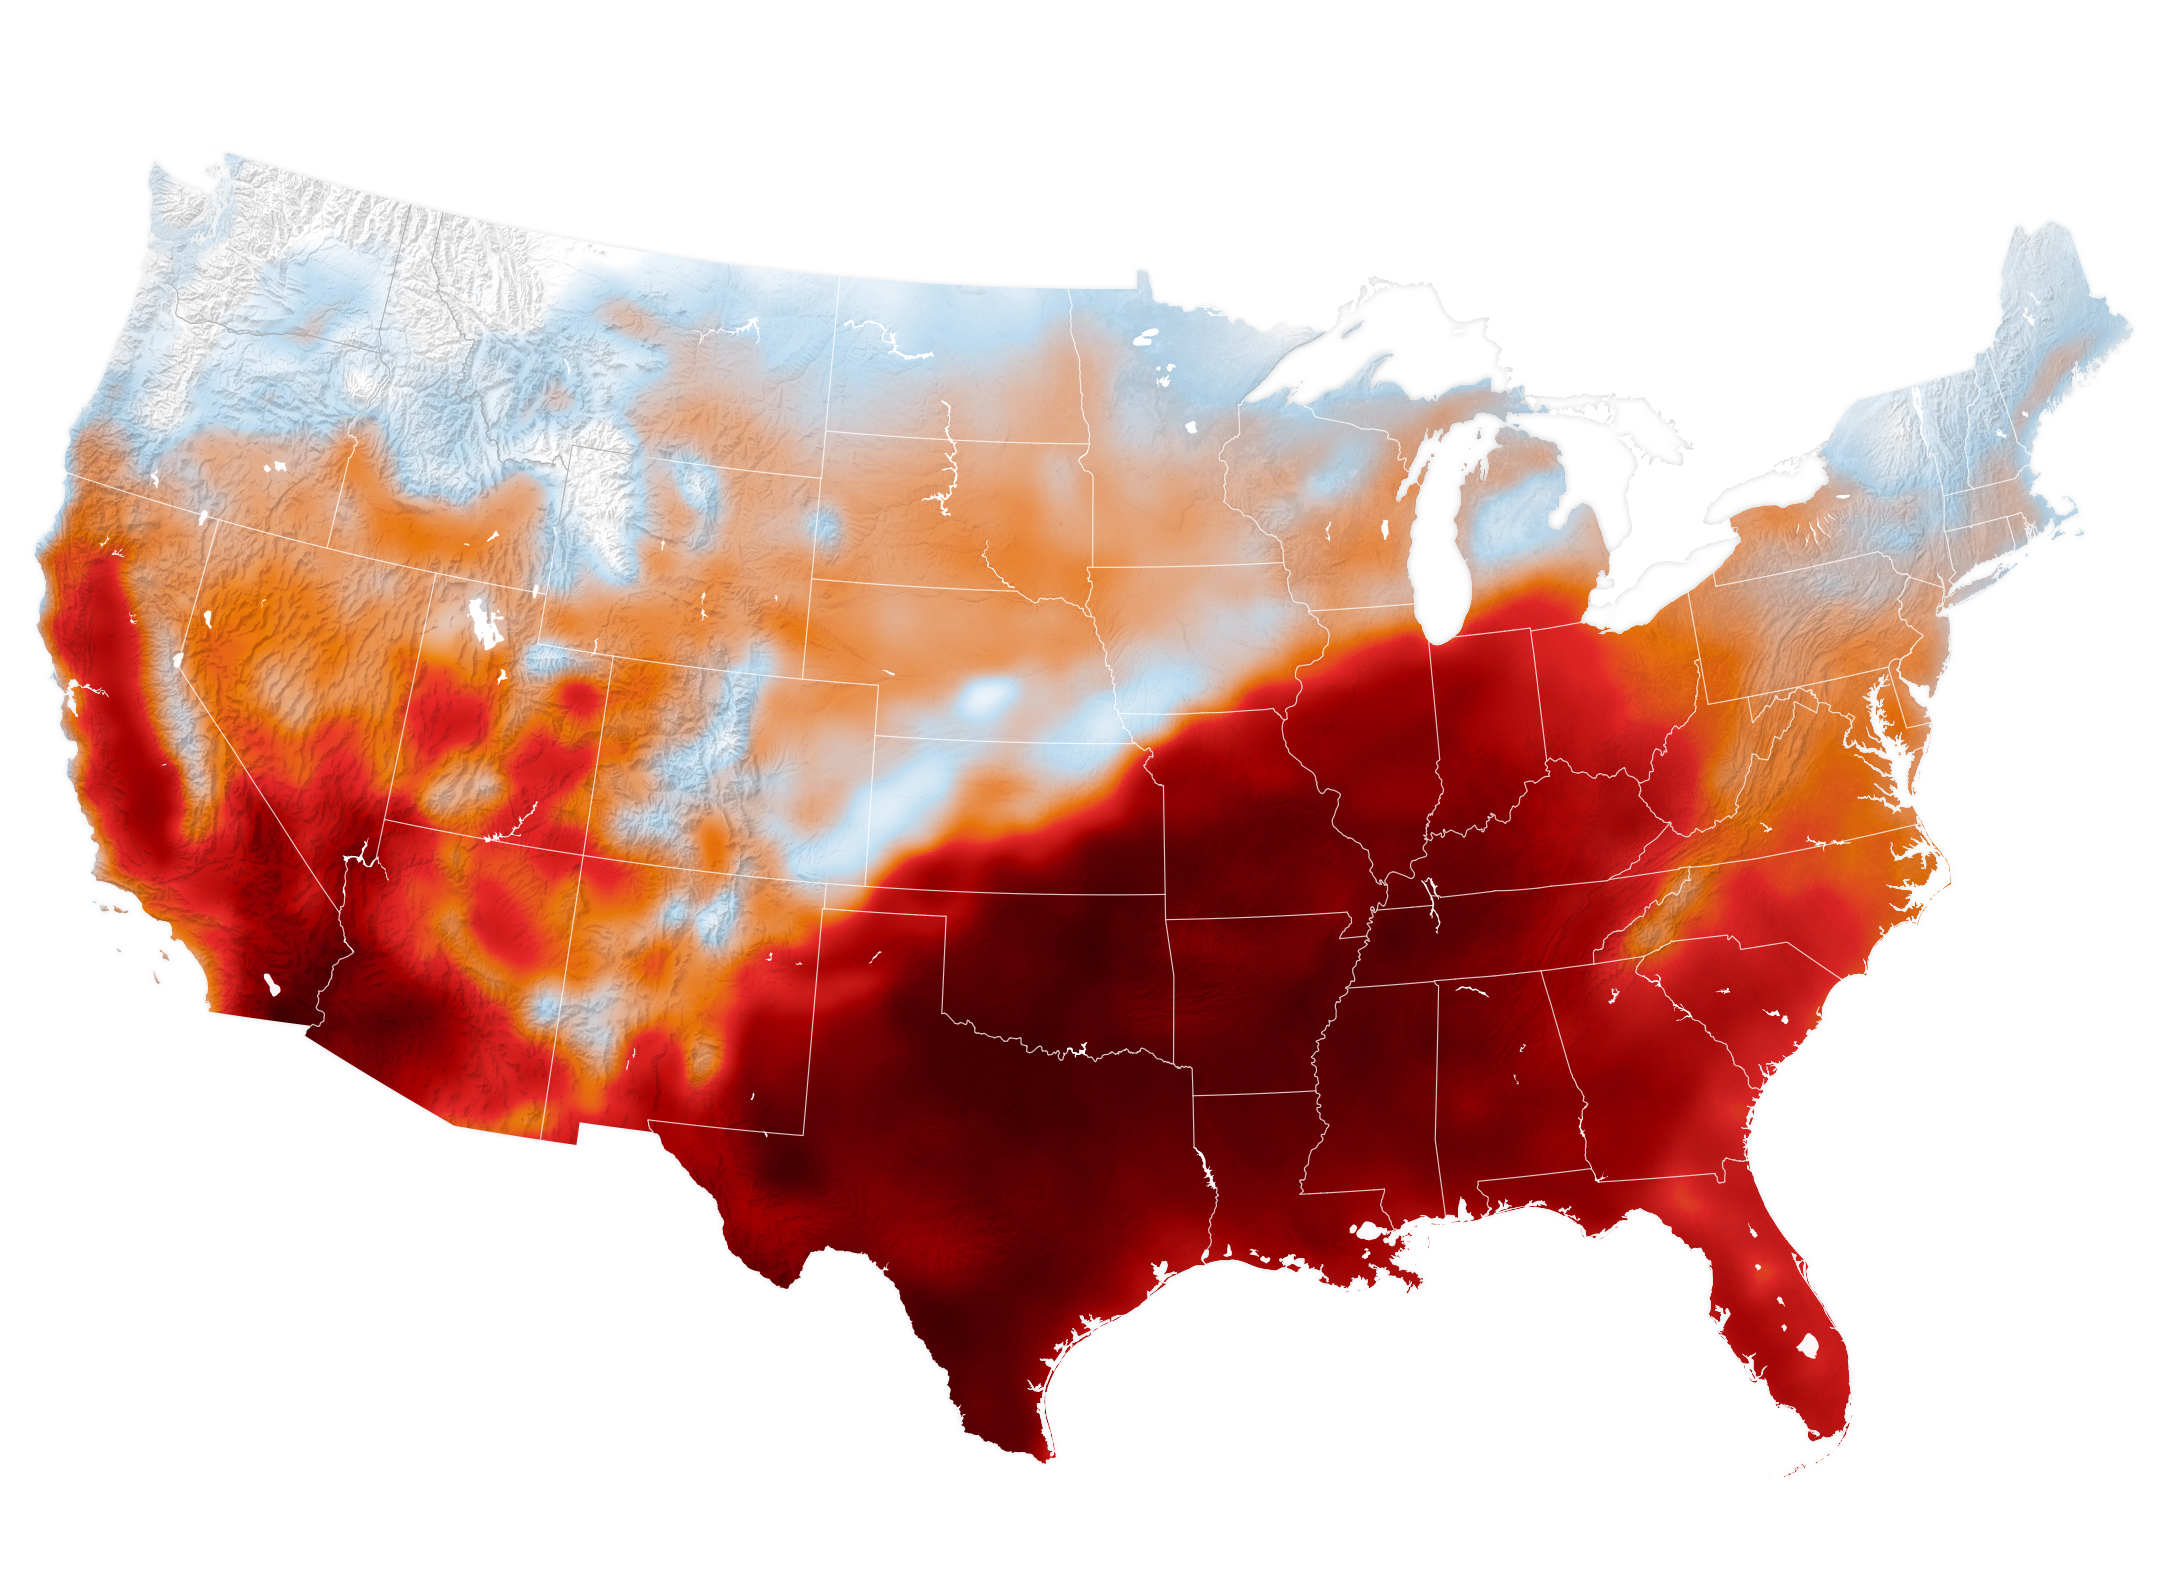
Air temperatures in the United States are depicted in white to light blue (cooler) and orange to red (warmer). An area of red, indicating temperatures around 100 degrees Fahrenheit, covers Texas and several states to the east and northeast.
An area of high pressure over the south-central U.S. produced unseasonable and, in some places, record-breaking warmth on September 15, 2026, as shown in this map of modeled air temperatures from GEOS (Goddard Earth Observing System).
NASA Earth Observatory/Michala Garrison

While the calendar indicated that astronomical summer was winding down, a swath of the south-central United States was sweltering under a heat dome in mid-September 2026.

This map shows air temperatures in the contiguous U.S. on September 15, 2026, at 4 p.m. Central Time (21:00 Universal Time), modeled at 2 meters (6.5 feet) above the ground. It was produced by combining satellite observations with temperatures predicted by a version of the GEOS (Goddard Earth Observing System) model, which uses mathematical equations to represent physical processes in the atmosphere. The darkest reds indicate areas where temperatures approached or exceeded 40 degrees Celsius (104 degrees Fahrenheit).

More than 41 million people in the U.S.—about 12 percent of the population—were under a National Weather Service extreme heat advisory, extreme heat watch, or extreme heat warning on September 15. The high temperatures spanned large portions of several states, such as Texas, Oklahoma, Arkansas, Missouri, and Tennessee. Meteorologists warned that high humidity, limited cloud cover, and light winds could make temperatures feel higher than thermometer readings and increase the risk of heat-related illnesses.

Several locations set new daily high temperature records on September 15. These included Dallas, Texas, at 101ºF (38ºC), Memphis, Tennessee, at 99ºF (37ºC), and Nashville, Tennessee, at 100ºF (38ºC). The cities were all at least 12ºF warmer than normal that day, with Nashville breaking its daily-high record from 1927. The day before, Nashville also set a record-high minimum temperature of 75ºF (24ºC).

A weather phenomenon meteorologists call a heat dome was responsible for driving temperatures up across the region. A heat dome develops when an area of high pressure in the upper atmosphere pushes hot air toward the surface and traps it there. Heat domes put the brakes on convection and suppress clouds and precipitation. This allows sunlight to reach Earth’s surface relatively unhindered and further elevate air temperatures.

The stretch of unseasonable temperatures follows the warmest June through August in the contiguous United States in a 132-year record, according to NOAA. The three-month period in 2026 was 0.4ºF warmer than the previous records, set in 1936 and 2021.

NASA Earth Observatory image by Michala Garrison, using GEOS-FP data from the Global Modeling and Assimilation Office at NASA GSFC. Story by Lindsey Doermann.

Downloads

Air temperatures in the United States are depicted in white to light blue (cooler) and orange to red (warmer). An area of red, indicating temperatures around 100 degrees Fahrenheit, covers Texas and several states to the east and northeast.

September 15, 2026

JPEG (1.22 MB)

References & Resources

You may also be interested in:

Stay up-to-date with the latest content from NASA as we explore the universe and discover more about our home planet.

Heat Dome Broils the Western U.S.
4 min read

A ridge of high pressure fueled record-breaking temperatures in Montana, Utah, and Wyoming on July 12, 2026.

Article
Europe’s Scorching Summer
6 min read

A series of heat waves in 2026 is breaking records and taking a toll in Europe.

Article
Sensing the Poles’ Hidden Heat
3 min read

New animations from NASA’s PREFIRE mission reveal two years of seasonal temperature swings at the Arctic and Antarctic.

Article

The post Summer Goes Out With a Heat Dome appeared first on NASA Science.

  •  

Summer Goes Out With a Heat Dome

Air temperatures in the United States are depicted in white to light blue (cooler) and orange to red (warmer). An area of red, indicating temperatures around 100 degrees Fahrenheit, covers Texas and several states to the east and northeast.
An area of high pressure over the south-central U.S. produced unseasonable and, in some places, record-breaking warmth on September 15, 2026, as shown in this map of modeled air temperatures from GEOS (Goddard Earth Observing System).
NASA Earth Observatory/Michala Garrison

While the calendar indicated that astronomical summer was winding down, a swath of the south-central United States was sweltering under a heat dome in mid-September 2026.

This map shows air temperatures in the contiguous U.S. on September 15, 2026, at 4 p.m. Central Time (21:00 Universal Time), modeled at 2 meters (6.5 feet) above the ground. It was produced by combining satellite observations with temperatures predicted by a version of the GEOS (Goddard Earth Observing System) model, which uses mathematical equations to represent physical processes in the atmosphere. The darkest reds indicate areas where temperatures approached or exceeded 40 degrees Celsius (104 degrees Fahrenheit).

More than 41 million people in the U.S.—about 12 percent of the population—were under a National Weather Service extreme heat advisory, extreme heat watch, or extreme heat warning on September 15. The high temperatures spanned large portions of several states, such as Texas, Oklahoma, Arkansas, Missouri, and Tennessee. Meteorologists warned that high humidity, limited cloud cover, and light winds could make temperatures feel higher than thermometer readings and increase the risk of heat-related illnesses.

Several locations set new daily high temperature records on September 15. These included Dallas, Texas, at 101ºF (38ºC), Memphis, Tennessee, at 99ºF (37ºC), and Nashville, Tennessee, at 100ºF (38ºC). The cities were all at least 12ºF warmer than normal that day, with Nashville breaking its daily-high record from 1927. The day before, Nashville also set a record-high minimum temperature of 75ºF (24ºC).

A weather phenomenon meteorologists call a heat dome was responsible for driving temperatures up across the region. A heat dome develops when an area of high pressure in the upper atmosphere pushes hot air toward the surface and traps it there. Heat domes put the brakes on convection and suppress clouds and precipitation. This allows sunlight to reach Earth’s surface relatively unhindered and further elevate air temperatures.

The stretch of unseasonable temperatures follows the warmest June through August in the contiguous United States in a 132-year record, according to NOAA. The three-month period in 2026 was 0.4ºF warmer than the previous records, set in 1936 and 2021.

NASA Earth Observatory image by Michala Garrison, using GEOS-FP data from the Global Modeling and Assimilation Office at NASA GSFC. Story by Lindsey Doermann.

Downloads

Air temperatures in the United States are depicted in white to light blue (cooler) and orange to red (warmer). An area of red, indicating temperatures around 100 degrees Fahrenheit, covers Texas and several states to the east and northeast.

September 15, 2026

JPEG (1.22 MB)

References & Resources

You may also be interested in:

Stay up-to-date with the latest content from NASA as we explore the universe and discover more about our home planet.

Heat Dome Broils the Western U.S.

4 min read

A ridge of high pressure fueled record-breaking temperatures in Montana, Utah, and Wyoming on July 12, 2026.

Article

Europe’s Scorching Summer

6 min read

A series of heat waves in 2026 is breaking records and taking a toll in Europe.

Article

Sensing the Poles’ Hidden Heat

3 min read

New animations from NASA’s PREFIRE mission reveal two years of seasonal temperature swings at the Arctic and Antarctic.

Article
  •  

Où sont passés les ouragans ? Nous sommes en plein pic de la saison et il n’y en a pas un seul : que se passe-t-il ?

À la mi-septembre, la saison des ouragans bat son plein. Mais cette année n’est pas comme les autres. Dans l’Atlantique, c’est le calme plat. L’année 2026 vient d’établir un nouveau record. Et les chercheurs montrent du doigt un responsable que vous n’attendez peut-être pas.

  •  

« Ce n’est pas possible » : ces scientifiques ont dû refaire l’expérience avant de croire ce qu’ils voyaient en Arctique

Dans le Haut-Arctique canadien, des chercheurs ont obtenu des résultats si inattendus qu’ils ont d’abord pensé à une erreur. Pourtant, expérience après expérience, le même phénomène s’est reproduit. Et il pourrait obliger les scientifiques à revoir la manière dont ils comprennent l’évolution des...

  •  

Why is Earth’s crust layered?

Since the formation of the Earth 4.2 billion years ago, hot rock from the interior of the planet has cooled off and developed crystals that accumulated over millions of years, forming surface rocks with a layered composition, referred to as continental crust. Geologic evidence of how continental crust formed comes from large, ancient crustal blocks, called cratons. Cratons have existed for billions of years and form the cores of continents. 

Scientists have shown that the upper 10 to 15 kilometers (6 to 9 miles) of continental crust contains high concentrations of elements like uranium and thorium that decay and release heat over time, referred to as radiogenic elements. However, the lower 20 kilometers (12 miles) of crust has very few radiogenic elements. The cause of this planetary-scale differentiation is highly questioned, as geoscientists don’t know what formation processes could produce this unique characteristic. 

Earlier researchers suggested that changes in the concentration of radiogenic elements could occur when tectonic plates collide. Plate collision induces temperatures in the lower crust high enough to melt minerals that contain uranium and thorium, like zircon and monazite. The newly melted minerals form magma, which then rises and crystallizes in the upper crust. To test whether this process formed the layered continental crust, researchers Andrew J. Smye and Peter B. Keleman incorporated geochemical data from studies worldwide into a mathematical model comparing how concentrations of radiogenic elements vary under different temperatures. 

The team separated their global analyses into 2 categories of rocks that were buried deep in the crust and subjected to intense pressures and temperatures, via a process known as metamorphism. The first category included rocks formed from the accumulation of eroded grains buried in the deep crust that are subjected to high pressures and temperatures, called metasedimentary rocks. The second category included rocks formed when magma rises from the deep Earth and solidifies before experiencing high pressures and temperatures, called metaigneous rocks.

The researchers analyzed 3 subcategories from each of the 2 types of deep-crustal rocks. The first was rocks that experienced no intense pressure or temperature, the second was rocks subjected to 650 to 900°C (about 1,200 to 1,650°F), and the third was rocks subjected to 900 to 1,100°C (about 1,650 to 2,000°F). The researchers modeled the geochemistry of the 3 rock types at different temperatures to determine whether ultra-high-temperature metamorphism could cause crustal differentiation of radiogenic elements.

Smye and Keleman found that monazite doesn’t melt in either metasedimentary or metaigneous rocks at temperatures below 900°C, as indicated by the relatively high thorium content in these deep-crustal rocks. Alternatively, they found that above 900°C, uranium and thorium concentrations decreased in metasedimentary rocks, suggesting that minerals like zircon and monazite were melting. The melted minerals enter magma and rise into the upper crust, leaving behind metasedimentary rocks depleted in radiogenic elements by around 0.10 ppm.  

The team concluded that the enrichment of uranium and thorium in the upper continental crust requires temperatures greater than 900°C to initiate the melting of zircon and monazite in the lower crust. Temperatures above 900°C are linked to the movement and collision of continental plates. This result suggests that evidence of Earth’s differentiation has been preserved for more than 3 billion years, spanning most of the planet’s geological history. Since stable continental crust formed, uranium and thorium enrichment in the upper crust has consistently recorded layering produced by ultra-high temperature metamorphism.

The post Why is Earth’s crust layered? appeared first on Sciworthy.

  •  

40 °C en France : nos villes sont-elles vraiment prêtes aux canicules de demain ?

Les étés européens ne ressemblent plus à ceux d'il y a trente ans. Les vagues de chaleur ne relèvent plus de l'exception statistique : elles s'installent comme une constante saisonnière. Nuits moites, sols fissurés, rails qui se dilatent. Un continent bâti pour un climat tempéré doit désormais...

  •  

The Met Office is No Longer a Serious Scientific Organisation

The Met Office has confirmed that its June temperature 'record' of 37.7°C came from a junk site. But rather than dropping it, it has upped it to 38°C! This not a serious scientific organisation, says Paul Homewood.

The post The Met Office is No Longer a Serious Scientific Organisation appeared first on The Daily Sceptic.

  •  

L’image qui a stupéfié le monde : derrière ce paysage irréel, 24 millions d’hectares sont partis en fumée

Pour les 25 ans de Futura, nos journalistes racontent une image qui a marqué leur regard sur ce premier quart de siècle. En 2019-2020, l’Australie traverse son terrible « été noir ». Pendant des mois, des incendies gigantesques dévorent le pays et donnent naissance à des images qui marqueront...

  •  

Cold shocks in a warming ocean affect large marine animals

In March 2021, the carcasses of at least 260 marine organisms from 81 species, including large animals called megafauna, washed ashore in South Africa. Scientists questioned whether this event was the result of an extreme temperature drop that can happen when deep, cold water rises to the surface along coastlines. Scientists refer to these rapid cooling events as coastal upwelling. 

Climate change is making oceans warmer, but it’s also making coastal upwelling stronger, with unknown consequences for marine megafauna. Scientists recently studied 2 boundary currents that are rapidly warming and creating strong upwelling near the edges of sharks’ geographic ranges: the Agulhas Current in southern Africa and the East Australian Current in eastern Australia. They wanted to determine whether climate-driven changes in upwelling zones are making cold-shock events more frequent and intense, and how these events are pushing sharks beyond their temperature limits. 

First, the researchers analyzed sea surface temperature data from satellites to see if rapid cooling from upwelling caused the mass marine die-off in 2021. They also obtained hourly temperature recordings from temperature loggers to measure subsurface temperature changes during the event. They found that during the March 2021 event, sea surface temperatures along the coast dropped by up to 7°C (12°F) in less than 48 hours, from 24°C (75°F) to below 17°C (63°F). Subsurface temperatures dropped faster, by more than 9°C (16°F) in 24 hours, from 21°C (70°F) to 12°C (54°F). 

Bullsharks experience physiological stress at temperatures below 19°C (66°F), which is near their lower thermal limit, when migrating through rapid cooling zones. Therefore, the researchers deduced that during the 2021 cold-shock event, the sharks were exposed to temperatures several degrees below their thermal limit, possibly more than 5°C (or 10°F) colder. 

The researchers also tagged 66 bull sharks with acoustic and satellite transmitters – including 41 at the Agulhas Current in South Africa and 25 at the East Australian Current in eastern Australia – to determine how they responded near their lower thermal limits in these zones. The acoustic tags record when sharks pass underwater receivers, providing information on their movements, locations, and water depths at those specific locations. In contrast, satellite tags continuously record the water temperatures and depths the sharks experience over time. 

The researchers used these data to compare sharks living in warm subtropical waters with those living in cooler waters at the edge of their temperature range. The researchers found that low temperatures that persisted for long periods prevented the sharks and other megafauna from physiologically recovering. They saw that some sharks try to swim to shallower depths and look for warmer water, but cooling sometimes happened faster than they could respond. 

The researchers also obtained wind records from the South African Weather Service to determine if upwelling-favorable winds happened before the 2021 event. They reported strong easterly winds pushing cold water on the surface along the coastline immediately before the event occurred. Because the cooling, strong winds, and animal deaths happened at the same time and place, the researchers inferred that upwelling was the main reason for the die-off.

Finally, the researchers examined 41 years of sea surface temperature data and used mathematical models to compute changes in the frequency and intensity of these events. Their analysis showed that rapid cooling events linked to upwelling can last a lot longer than the usual 1 to 3 days. For example, the March 2021 event lasted for 7 days. 

They found that these events have increased in both frequency and intensity in the past decades, and produce more extreme temperature drops than typically happen within 24 hours. Their results suggested that the 2021 die-off was part of an increasing trend, where warming oceans allow species to move into different areas, but intense upwelling can suddenly expose them to fatal cold events. This pattern is what scientists call a climate bait-and-switch. 

The researchers concluded that climate change is making coastal upwelling stronger, which can push marine megafauna beyond their thermal limits, even when initial warming appears to be beneficial. Their findings highlight an understudied aspect of climate change in the context of how temperature and upwelling cause shifts in species survival. They concluded their findings could help predict how marine ecosystems respond to future changing ocean conditions.

The post Cold shocks in a warming ocean affect large marine animals appeared first on Sciworthy.

  •  

Il a fait plus chaud en France que sur 99,02 % de la planète : comment en est-on arrivé là ?

Ce n’est pas une canicule comme les autres. Ce 23 juin 2026, la France a basculé dans un autre climat. Records pulvérisés, températures dignes du Sahara, chaleur inédite à l’échelle nationale : en une seule journée, le pays a vécu ce que les scientifiques redoutent depuis des décennies. Et ce...

  •  

Vous avez beaucoup de grains de beauté ? Cette étude révèle pourquoi il faut les surveiller

Chaque été, les dermatologues rappellent l'importance de protéger sa peau du soleil. Mais une vaste étude génétique menée par des chercheurs australiens montre que le risque de mélanome ne dépend pas seulement des UV. 

  •  
❌