 Login
 This is spooky!
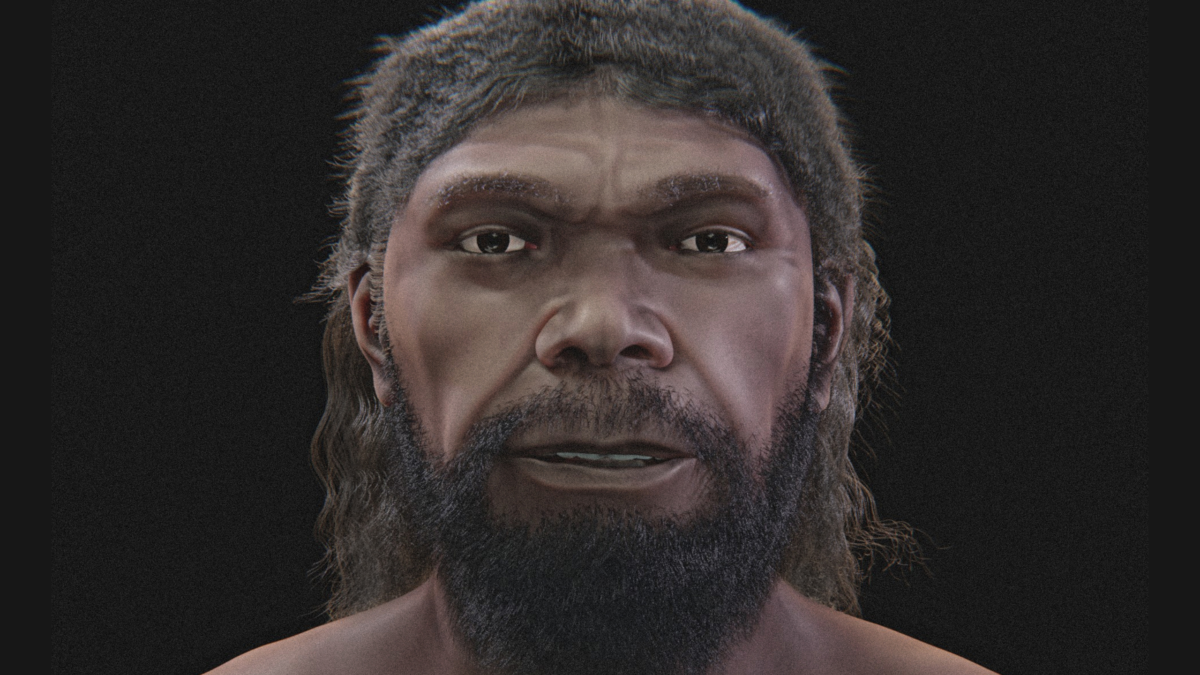 Here's looking at you.


Objective: Investigate color perception by observing afterimages, which are the images left on your retina after you stare at an object and then look away.
Areas of Science: Human Biology & Health
Difficulty: Intermediate medium
Time required: Short (2-5 days)
Prerequisites: A computer with internet access is recommended.
Material availability: Readily available
Cost: Very Low (under $20)
Safety: No issues
Credits: David Whyte, PhD, Science Buddies
We perceive color in the world around us with special sensory cells, called cone cells. Cone cells function in bright light and are responsible for color vision and high-acuity vision, which allows you to see fine details. Cone cells reside in the region at the back of the eye called the fovea. The fovea is quite small, about 1 square millimeter (mm) (0.00155 square inch). It is amazing to think that color and detail we see depends on such a small bit of tissue!
There are three types of cone cells, loosely called blue, green and red, depending on which type of light they respond to best. When you look at a red object, for example, the red cone cells are stimulated. The stimulation of the red cone cells causes them to send a message to the brain, basically saying, “the color of the object is red.”
When blue light and red light are added, it creates the color purple. So when you see the color purple, your blue and your red cone cells are both stimulated.
What about white? If you have seen a rainbow, or the colors produced when sunlight passes through a prism, you have seen for yourself that white light can be separated into different colors. Adding blue, green and red light together produces white light. If you take three flashlights and put red, blue and green filters on them, and shine them all on the same spot, the combined colors produce white light.
Any two colors whose light together produces white are called complementary colors. Examples are red and cyan, green and magenta, blue and yellow. Note that one color in the combination is a primary color, while the other is a mix of the other two primary colors.
When you look at a white image, all three types of cones are stimulated. In other words, the brain interprets the combined input from all three types of cones and tells you that “the color is white.” Note that the way colors of light combine is called additive color mixing, where the three primary colors combine to make white. This is different from the subtractive color mixing you may have learned about when mixing paints together in art class, where if you mix the primary colors together, you will get black.
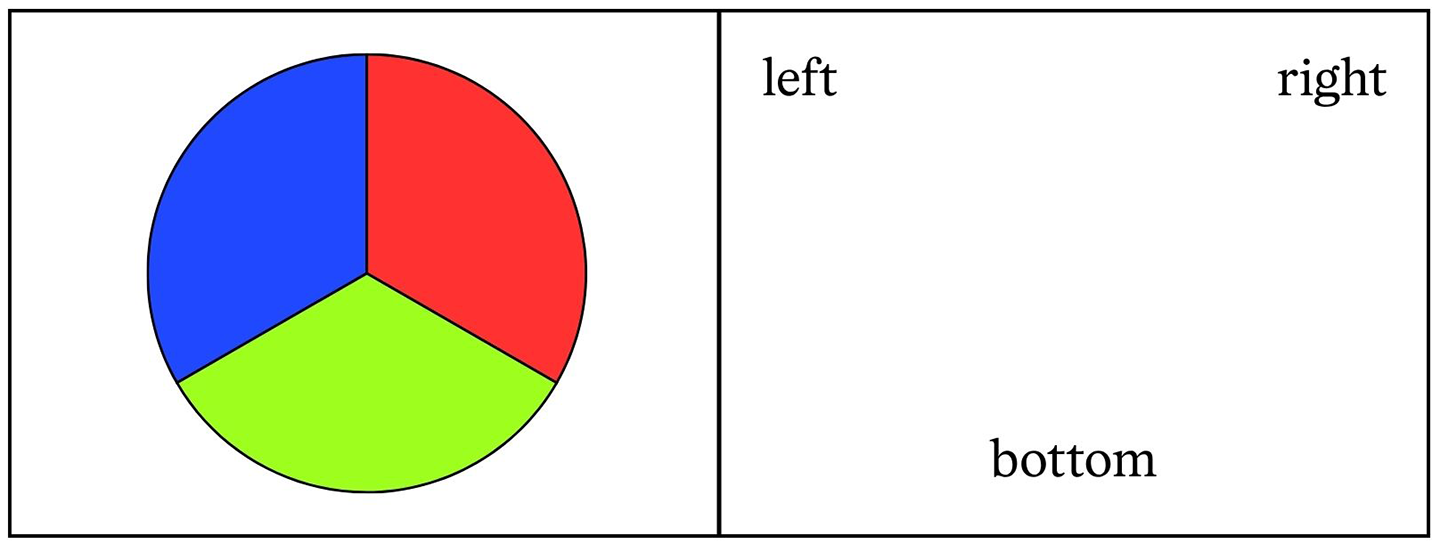
Looking at a particular color for very long can cause cone cell fatigue — the cone cells get tired. For example, if you stare at a red object, the red cone cells become fatigued and are temporarily unable to respond. If you look at a white area after staring at a red image, you will see an image that is the same size and shape as the original image, but a different color. The image you see on the white surface is called an afterimage. You can see an afterimage by looking at the red circle in Figure 1 in the Experimental Procedure for 30 seconds, then looking at the white region in the square to the right. Can you see the blue-green afterimage?
Why is the afterimage blue-green? When you look at the white surface after staring at the red-colored object, your eyes will essentially receive equal doses of red, green and blue light coming into your eyes, but only the blue and the green cones are able to respond and tell your brain what you are seeing. Because of cone cell fatigue, the input from the red cones is missing from the region of the afterimage. So you see the afterimage as blue-green. (Here is a gross fact! Surgeons wear blue-green scrubs to minimize the afterimage of blood!)
The afterimage disappears after several seconds because the red cone cells recover from their fatigue and become active again. When the red cone cells are active again, all three types of cone cells respond to the white surface, and you see the white region normally. You can even predict the color of the afterimage for most colors — it is the complementary color to the color of the object.
In this human biology project, you will investigate how your cone cells respond to various colors by observing afterimages.
Submit your question here, and we might answer it an upcoming issue of Science News Explores
This article in The Caltech Weekly about the work in the Shimojo Laboratory at the California Institute of Technology has some nice afterimage information:
This site, from the University of Washington, has a wealth of information about neuroscience, the eye and afterimages:
A visual illusion based on cone cell fatigue won a contest by the Neural Correlate Society for “The Best Visual Illusion of 2008.” You can see the illusion here:
There are three parts. Each part should take less than one hour.
In Part 1, you will stare at a colored object for various amounts of time, then measure how long it takes for the afterimage to disappear each time. You will then graph the data as Cone stimulation (how long you stared at the colored object) vs. Afterimage persistence (how long before the afterimage disappears). Things to think about: Is there a minimum cone-stimulation time required to produce an afterimage? Do longer cone-stimulation times always cause longer afterimage times, or does the effect level out past a certain time?
In Part 2, you will test whether or not afterimages made by three different colors disappear at the same rate (this measures cone cell recovery).
In Part 3, you will test which color produces an afterimage in the least amount of time (this measures the rate of cone cell fatigue).

| Afterimage Persistence (seconds) | ||||
| Cone Stimulation (seconds) | Red Circle Trial 1 | Red Circle Trial 2 | Red Circle Trial 3 | Red Circle Average |
| 5 | ||||
| 10 | ||||
| 20 | ||||
| 30 | ||||
| 60 | ||||
This activity is brought to you in partnership with Science Buddies. Find the original activity on the Science Buddies website.

On haunted history tours, people often visit eerie theaters and spooky mansions. Such old buildings are often settings for spine-tingling stories. They may also hum with noise too low to hear, from old plumbing or air ducts. That unheard sound, called infrasound, might be one reason these places give people the creeps. A new study hints that even though people can’t hear infrasound, it may influence their mood.
Infrasound is noise with frequencies below 20 hertz — around the lower limit of what humans can hear, says Kale Scatterty. A behavioral neuroscientist, he works at the University of Alberta in Edmonton, Canada. Some natural sources, such as the rumblings of volcanoes and earthquakes, produce infrasound. Traffic, trains, air conditioning systems and other tech also make this low-pitched noise.
Humans and many animals can’t hear infrasound. But past studies have suggested that animals may detect it with their bodies — and that it might even provoke anxiety or fear. Scatterty’s team wondered if people could detect infrasound. Our ears contain otolith organs that help us perceive our movement and position. These organs might pick up on vibrations too low to hear.
Scatterty and his colleagues had 36 people listen to music. Half of them were exposed to infrasound while they listened. The others were not. The scientists then compared the two groups’ responses to the music.
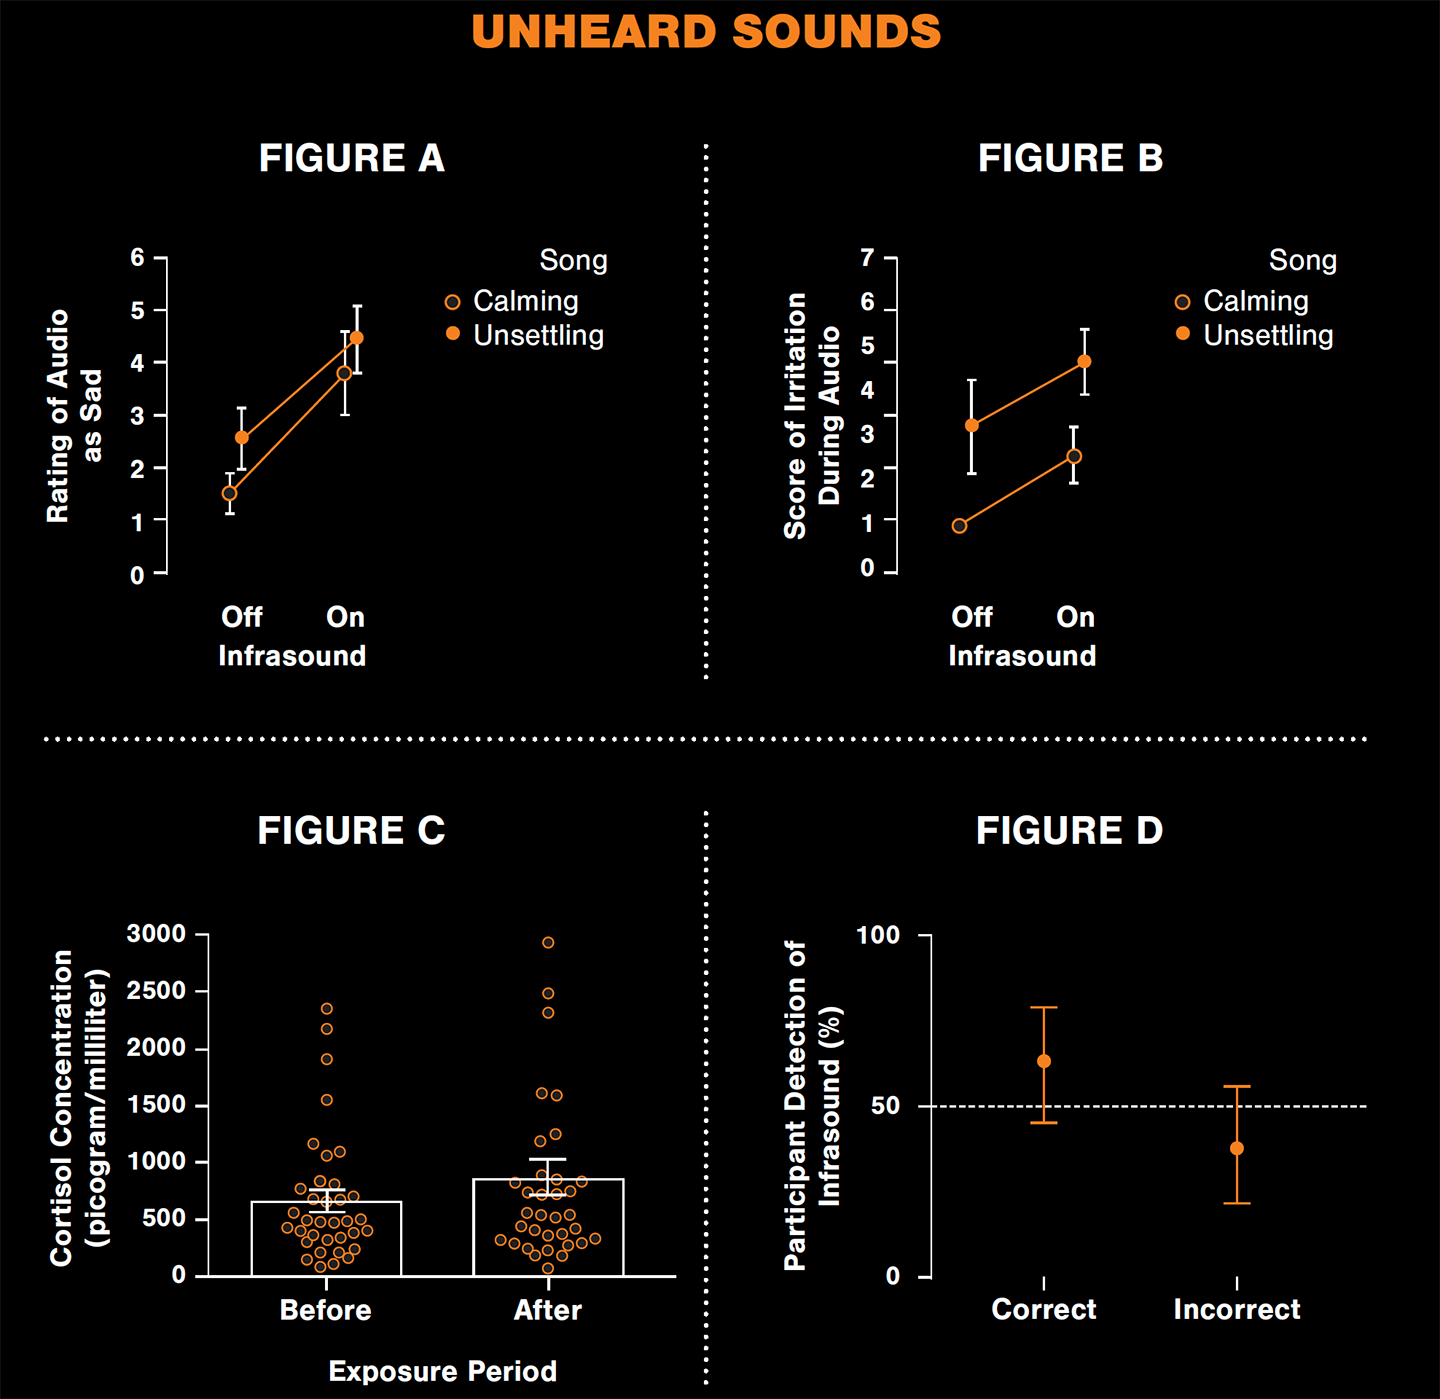
People exposed to infrasound rated music as sadder than those who heard it without infrasound. This was true whether the music itself was calm or unsettling. The infrasound group also said the music was less interesting and reported being more irritable. Cortisol, a stress hormone, was higher in people’s saliva after they experienced infrasound. But people couldn’t seem to tell whether they were in the infrasound group.
The results suggest that infrasound does influence humans’ mood and biology. It seems to happen without people being conscious of it, Scatterty says. The team shared its findings April 27 in Frontiers in Behavioral Neuroscience.
Submit your question here, and we might answer it an upcoming issue of Science News Explores
Infrasound might especially affect people and animals near urban environments, Scatterty says. Those places have transit, air conditioning systems and other infrastructure that creates such low-frequency noises. But it’s not clear what the long-term impacts of infrasound exposure might be.
Another open question is whether infrasound provokes fear, he says. In this study, the participants — college students — didn’t report feeling scared or anxious when exposed to infrasound. And the emotional changes the team did measure could have been responses to the study setup. “It could have very well just been that we were priming them to feel something,” Scatterty says. And the students might have felt irritable because they had other places to be.
But a spookier environment might help deepen the investigation. Scatterty and his colleagues have thought about studying infrasound in a haunted house set up for Halloween. “Maybe when you’re in a haunted house, yes, you would react more fearfully because you’re primed to be afraid of something.”
Researchers outfitted two rooms with speakers to play music. Outside of those rooms were two subwoofers — speakers that produce low sounds. In this study, they played infrasound.
The 36 study participants heard either a soothing song that might play at a spa or an eerie tune that would fit in a horror film. Half of the participants heard the music while infrasound played. The team then asked people how the music sounded and how it made them feel.
The researchers compared the answers of those who listened to music with the infrasound off and on (Figures A and B). They also sampled the study participants’ spit to study whether cortisol concentration — a marker of stress — was higher after infrasound exposure (Figure C shows individual measurements as dots and the averages as bars). After answering these questions, participants said whether they thought they had been exposed to infrasound (Figure D).

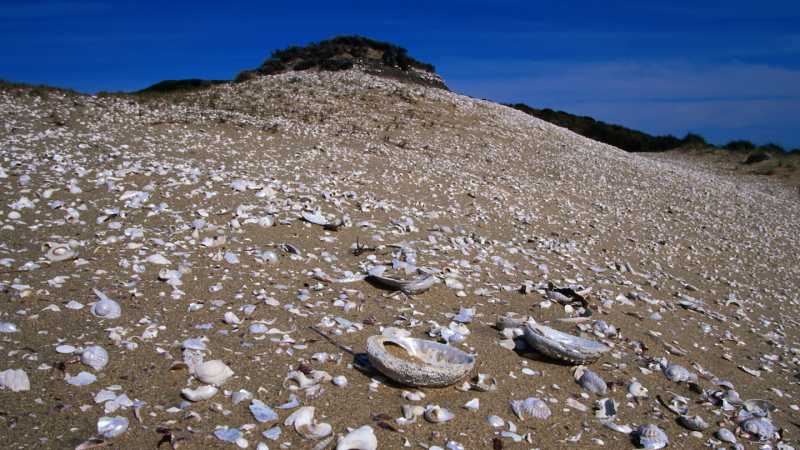
A midden is a garbage pile or dump site left by ancient people. This word also describes a pile of items gathered by an animal.
Old trash heaps can contain artifacts of ancient life. Fossilized scraps from a kitchen dump site can tell us how our ancestors cooked their food. Other sites may contain broken tools, pottery fragments or other clues about people of the past.
Imagine you live in an ancient village along a coastline. You and your people catch food from the sea, especially clams and mussels. You sit at the same site each day to crack open shells and extract the meat. You toss empty shells into the same pile. A thousand years later, an archeologist discovers this shell midden.
From this trash heap, the archeologist might learn more than just what was on your menu. They also might estimate how many people lived in your village and whether you used tools to open shells.
Dump sites containing many shells also create a unique environment that helps preserve fragile materials. Calcium minerals leached from old shells create a low-acid environment. This helps keep bone, fish scales and other biological materials from dissolving. A fragile bone tool, discarded in such a heap, stands a better chance of staying intact.
The word midden also refers to a pile of items collected by an animal. Many rodents create such piles. Squirrels gather and store food in middens. Rats hoard trinkets — such as pieces of trash, beads or seeds — in piles. Many rats even seal their hoards by peeing on them. Rat pee hardens into a shell-like substance called amberat.
Crystallized rat pee repels water and helps preserve the rat’s collection. Throughout human history, rats have lived alongside us. That means that rats may store artifacts from humans in their middens. So, archeologists may study fossilized rat middens for clues about ancient human societies.
Fossilized rat middens can offer a glimpse into the ancient life — not just of rodents, but also of the humans they lived beside.
Check out the full list of Scientists Say.
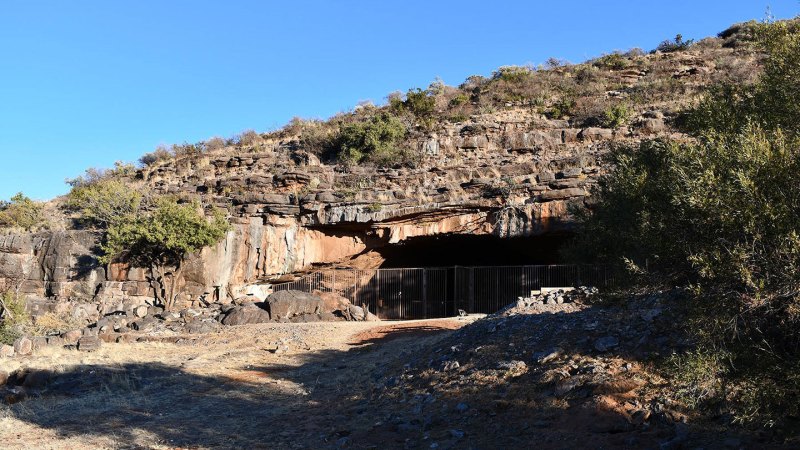
A cave in Africa seems to host the oldest known traces of humans using fire. Burnt remnants of animal bones hint that groups of Homo erectus used fires here as long as 1.8 million years ago.
The site is known as Wonderwerk Cave. It’s in the Northern Cape province of South Africa. The oldest previously known traces of our early relatives using fire also came from there. Those dated to about 1 million years ago.
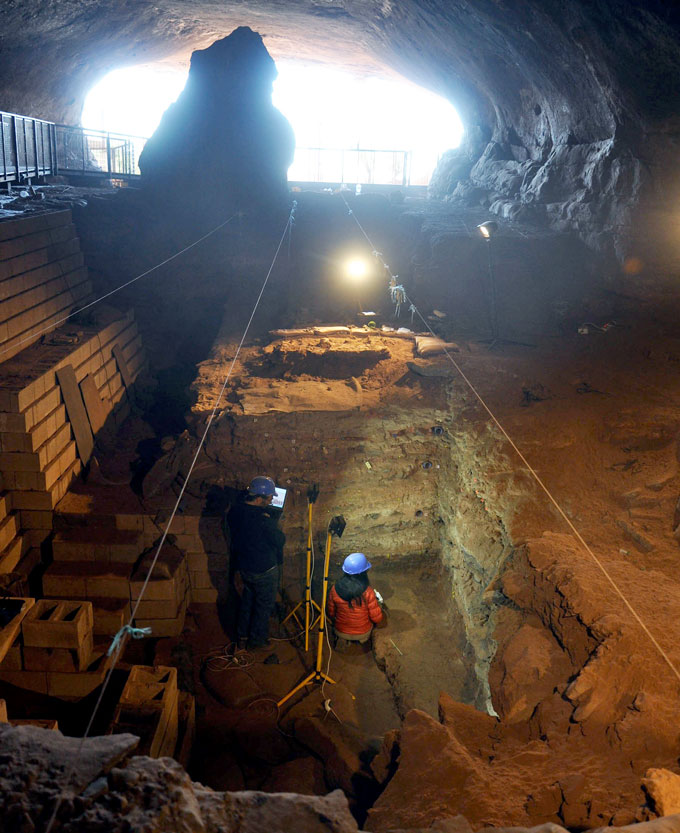
The new evidence comes from an earlier, deeper level of sediment in that cave. These traces of fire could be anywhere from 1.07 to 1.79 million years old. But “I’m very comfortable saying it was between 1.7 and 1.8 million years ago,” says Michael Chazan. This archaeologist works at the University of Toronto in Canada. He leads excavations at Wonderwerk Cave.
Chazan was part of a team that shared the new findings June 1 in PLoS One.
The researchers don’t think H. erectus lit the fires. The earliest evidence of people using iron pyrite to make sparks dates to about 400,000 years ago. So people in the Wonderwerk Cave probably carried in flames from wildfires, Chazan says. “This is not human ignition of fire. It’s collecting a fire on the landscape.”
These were likely not cooking fires, but ones used to give light and warmth.
Chazan’s team detected burnt bones at the fire sites with a blue-light technique that forensics experts use to solve crimes. It’s called “luminescence.” Until now, no one had used it in archaeology. The bones came from owl pellets. (Owls cough up such balls of fur and bone after eating.) When examined under blue light, the burned bones glowed more brightly than unburned ones.
Archaeologists already knew that Wonderwerk Cave was probably home to groups of H. erectus at this time. Barn owls also likely sheltered in the cave while these ancient humans lived there, Chazan says. People kept fires going on the pellet-strewn floor. This could explain the finding of burned bones.
Ancient people didn’t seem to always have fires in Wonderwerk Cave. “There’s a clear signal [of fire],” Chazan says. “But it’s not of year-round access to fire.” Wildfires likely happened only in hot seasons. That may not have been often enough for H. erectus to make any lasting lifestyle changes based on access to flames.
Scientists have theorized for decades about how the human brain evolved and grew dramatically in size. Now, new research points to one common ingredient that may have played a crucial role in the brain’s evolution over time: sugar.
A research team at the University of Sydney and the University of Glasgow created a model comparing modern nutrition with that of our ancestors over a span of four million years. The findings suggest that our ancestors relied on naturally occurring carbohydrate-rich foods, which could have played an important role in not only their overall dietary nutrition but also the evolution of the human brain.
These new findings challenge an older scientific model that emphasizes meat as a primary driving force behind human evolution.
“Raw starch does not release glucose, meaning early humans likely relied on naturally sweet foods long before grains became a regular part of the diet,” said lead author Professor Jennie Brand-Miller, Professor of Human Nutrition at the University of Sydney Charles Perkins Center and School of Life and Environmental Sciences, in a statement.
While meat played a role in our ancestors’ diets, the new research suggests that the amount of energy required by a growing brain also needs to be considered. Throughout human evolution, brain size increased from roughly 300 grams in early hominins to approximately 1,500 grams in modern humans. Glucose is the brain’s primary energy source, creating increasing nutritional demands as brain size grew over time.
“While animal foods were important, the brain’s need for glucose has largely received little attention from anthropologists,” Professor Brand-Miller said.
To better understand this hypothesis, the team created a model encompassing six evolutionary stages. Researchers estimated the “obligatory glucose demand” of the brain and other glucose-dependent tissues, including red blood cells, kidneys, and reproductive tissues. They then compared these glucose requirements with the carbohydrate sources that would have been readily available to humans during different stages of evolution.
“The human brain is unusually large for our body size and requires substantial amounts of energy,” Professor Brand-Miller said. “Glucose is the brain’s primary energy source, and for much of human evolution, would have come from carbohydrates found in foods such as fruit and honey.”
The model incorporated evidence from numerous fields, including metabolism, food composition, fossil isotope studies, dental morphology, archaeology, primate diets, and genetics.
Overall, the research suggests that early hominins, including Australopithecus, Homo habilis, and Homo erectus, were highly dependent on carbohydrate-rich foods, with fruit representing an important source. Later, as humans began using fire to cook food, starch-rich plants could also provide significant amounts of glucose. Grains, meanwhile, appear to have entered the human diet much later. The researchers point to archaeological evidence of seed grinding dating to around 65,000 years ago.
“People often think of carbohydrates as breads and cereals, but for most of human evolution carbohydrates came from fruits, honey and underground plant foods,” said Professor Brand-Miller. “The earliest evidence of seed grinding is 65,000 years ago, when we see the first evidence of grinding stones to make flour.”
The study also examined the role of glucose in reproduction and pregnancy. Pregnancy and lactation significantly increase glucose demands, since energy is required not only by the mother but also by the developing fetus and placenta, as well as for milk production.
The new findings may also help explain humans’ longstanding attraction to sweet foods. For much of human evolution, naturally sweet foods such as fruit and honey provided concentrated sources of energy while also supplying fiber, vitamins, minerals, and other nutrients.
That doesn’t mean people should start making a run for the candy aisle. The findings do not suggest that modern humans should consume more refined sugar. Instead, the researchers distinguish between naturally occurring sugars found in whole foods and highly processed foods containing large quantities of added sugar.
Sugar was also not the human brain’s only source of fuel, nor were carbohydrates the sole dietary factor influencing human evolution. Rather, the researchers argue that glucose requirements have often received less attention than other dietary factors, including meat, fat, and protein. Our ancient appetite for naturally sweet, carbohydrate-rich foods, however, may have helped fuel the extraordinary expansion of the human brain.
Chrissy Newton is a PR professional and the founder of VOCAB Communications. She currently appears on The Discovery Channel and Max and hosts the Rebelliously Curious podcast, which can be found on YouTube and on all audio podcast streaming platforms. Follow her on X: @ChrissyNewton, Instagram: @BeingChrissyNewton, and chrissynewton.com. To contact Chrissy with a story, please email chrissy @ thedebrief.org.
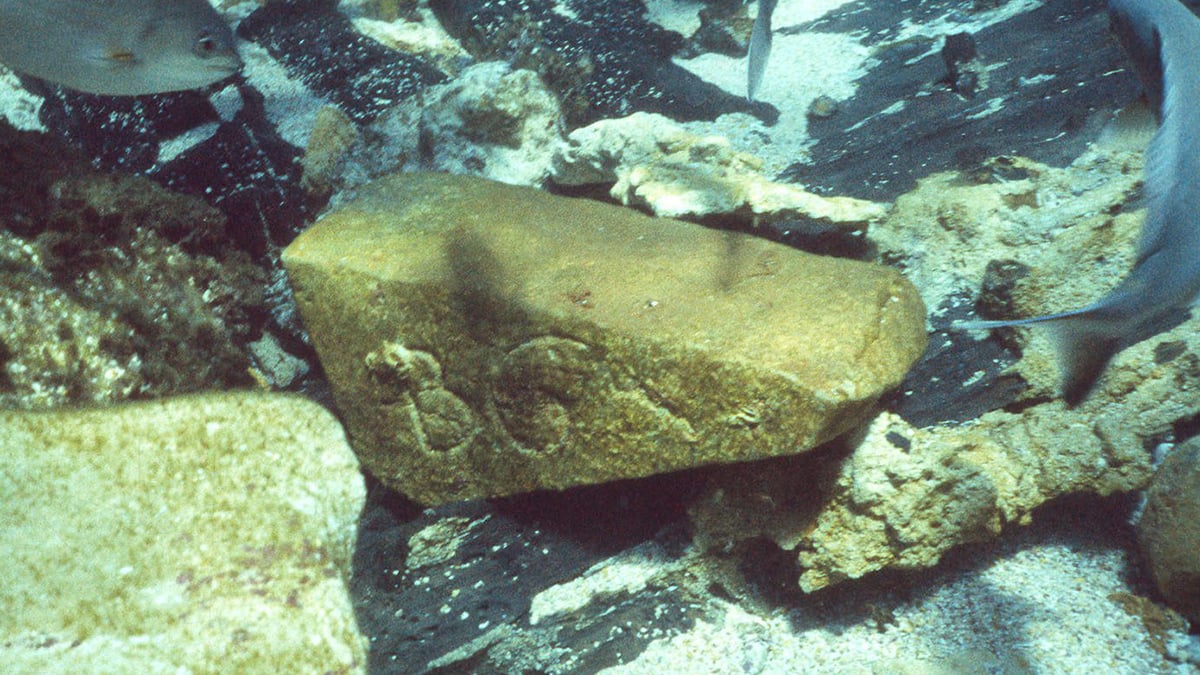 New secrets are surfacing from a gruesome episode at sea.
Neanderthals and modern humans did not simply occupy the same landscape and disappear from one another’s story. A study of Üçağızlı II Cave in southern Türkiye points to a longer period of cultural continuity in the northern Levant, where stone tools, shell ornaments and other remains appear across a sequence spanning more than 20,000 years. […]
The post Did Neanderthals and Modern Humans Share a Culture for 20,000 Years? appeared first on Curiosmos.

 Modern humans and Neanderthals may have shared more than land and genes. They may have also shared culture. Modern humans and Neanderthals may have shared more than territory, tools, and genes. New evidence from a cave in southern Türkiye suggests the two groups may also have exchanged ideas and developed similar symbolic traditions over thousands [...]
 "Our goal is to produce the largest and most diverse dataset on human problem-solving behavior recorded to date."

 It's complicated.
 It’s not just you.
 The closest you can get to time travel.
 The first evidence of its kind.
 Our brains hurt....
 You're not alone.