About 2,000 years ago, while Augustus ruled Rome, a leftover patch of ice in the Canadian Arctic stopped shrinking and began to grow. A team from the Lamont-Doherty Earth Observatory, part of Columbia University, argues that this turning point marked the beginning of the next glaciation, what most people would call the next ice age. […]
Sailor Matt Rutherford has dreamed for several years of becoming the first person to circumnavigate the Arctic Ocean solo, nonstop and unassisted. He finally set out from western Greenland on June 25 to achieve this goal, but threatening encounters with Russia's security agency less than two months later forced him to reverse course.
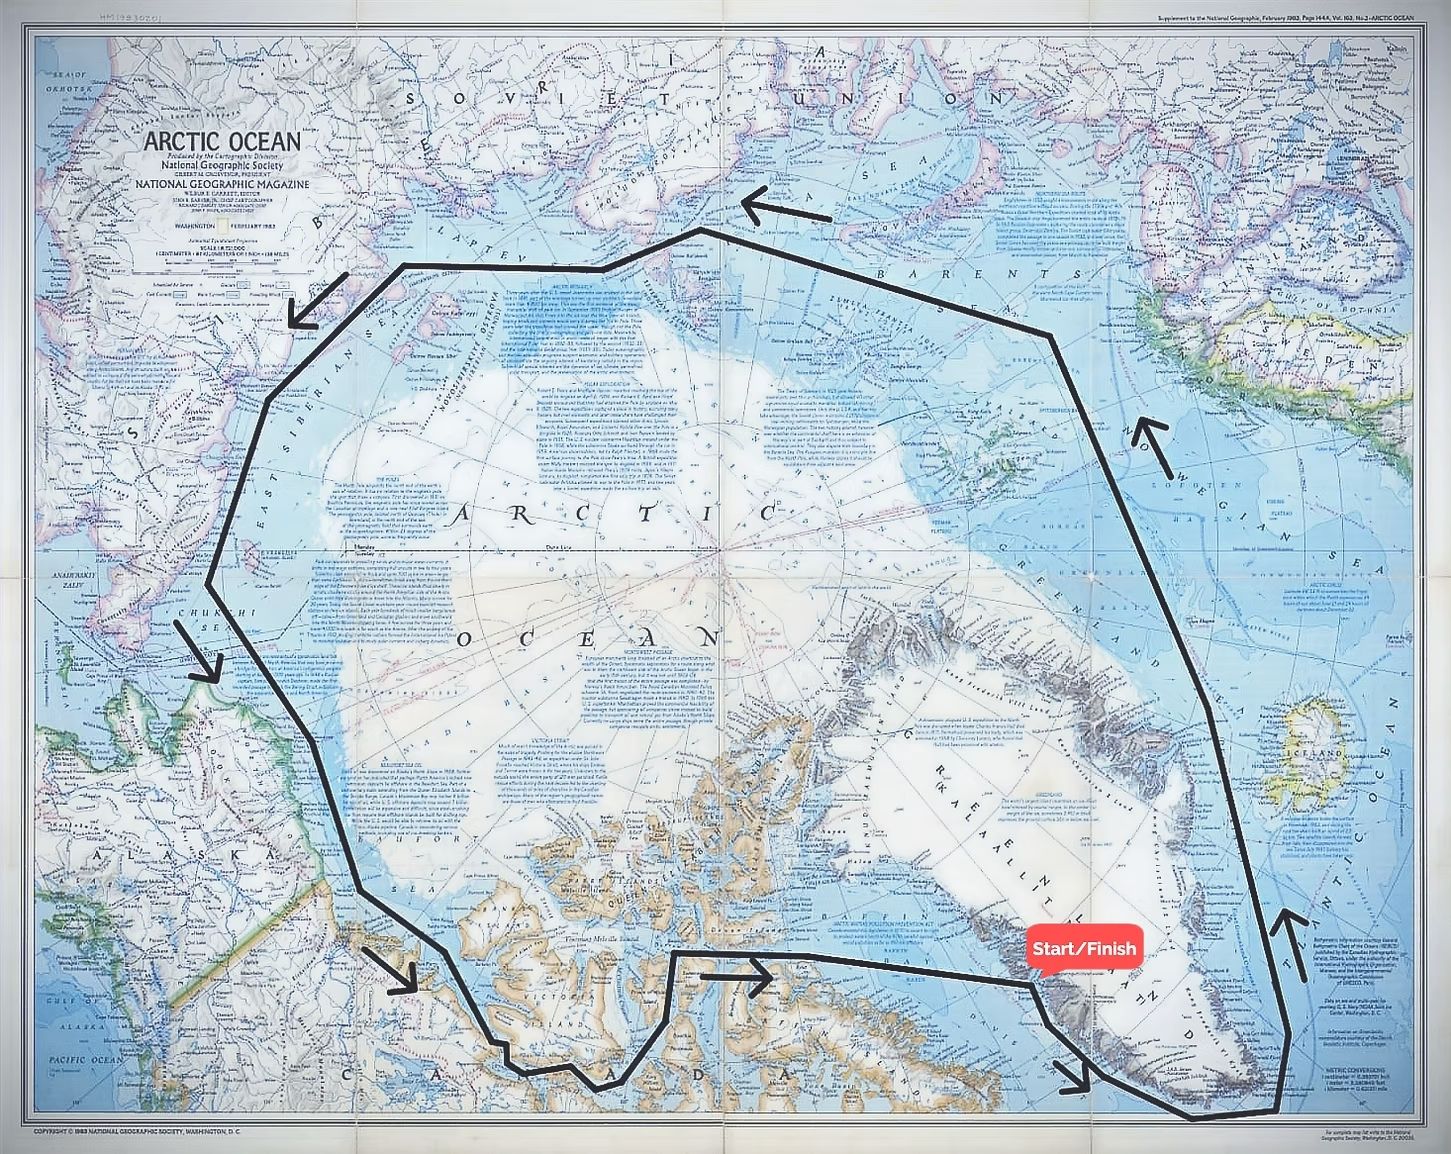
Rutherford is the founder and executive director of the nonprofit environmental organization Ocean Research Project, which gathers and analyzes marine data from a sailboat. His route took him around the southern tip of Greenland, through the Denmark Strait and into the Greenland Sea. From there, he sailed through the Norwegian and Barents seas, and reached Russia's Novaya Zemlya archipelago in mid-August.
He was planning to continue to Canada and end his journey where it started, but Russian officials halted him in his tracks and ordered him to turn around.
On his way home, Rutherford told Live Science about his adventures and why he wants to complete this loop. In an interview on Sept. 23, he also revealed what he'll do differently on his next attempt to avoid another Russian interception.
Sascha Pare: Where are you currently, and what are the conditions like?
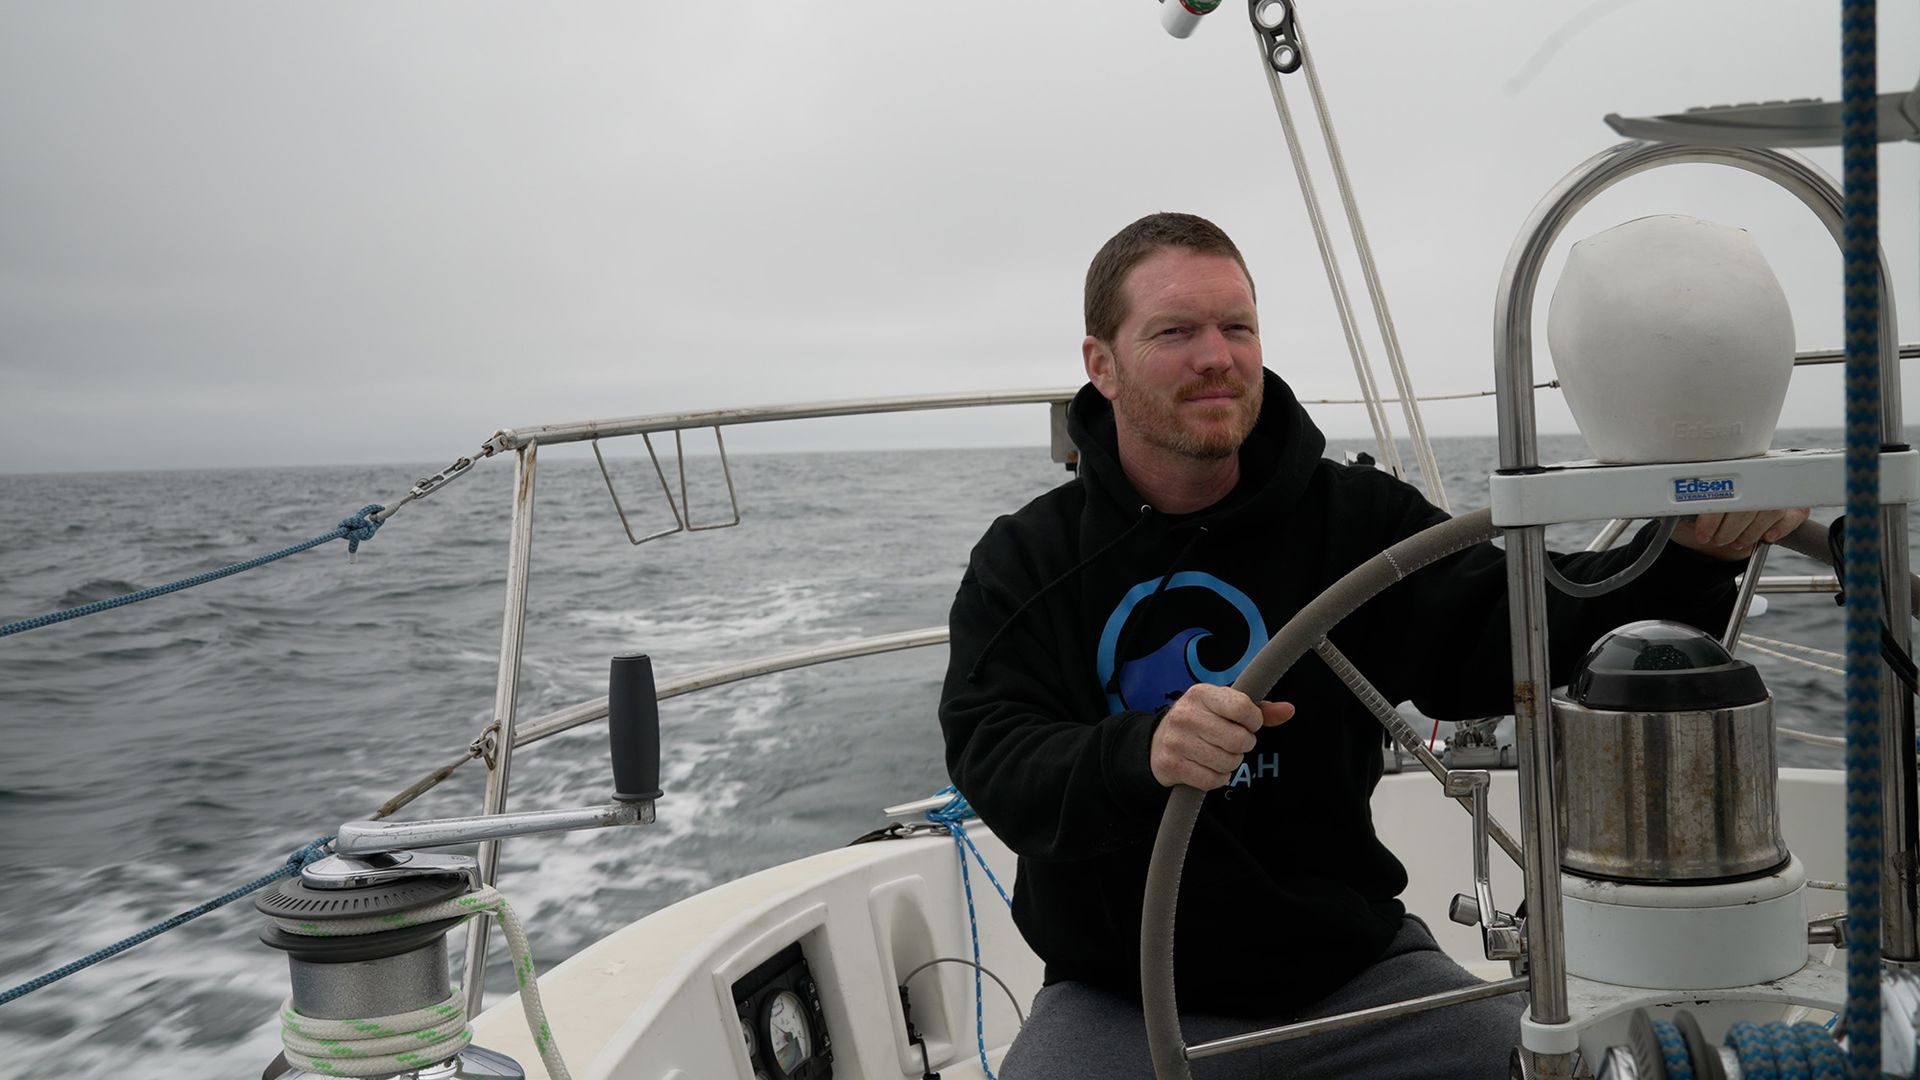
Matt Rutherford: I'm about halfway between Greenland and Newfoundland in the Labrador Sea. The conditions aren't too bad; I mean, it's close to a gale, but it's not quite a gale. [Editor's note: A gale is defined as an area of sustained surface winds of 34 to 47 knots (39 to 54 miles per hour).] It's just a little hard to do anything. I've got dishes in the sink that are all wedged in there that I really need to deal with — but I don't feel like it, because you're just getting tossed around. Waves are crashing on the cockpit. Normally, I do video calls under a dodger [a canvas screen on a boat or ship that provides protection from spray], and you can see the ocean in the background… But I'm going to get hit by a wave if I do that.
SP: You're sailing home to Maryland after a rather perilous expedition. How long have you been at sea for?
MR: I left in mid-May, and I've been basically underway for the most part since then. At this time, currently, I've only been at sea for a few days, because I left Greenland a few days ago. The longest stretch I was continuously at sea this year is 59 days, although I was planning on doing longer than that, so that sucked. Essentially, I was attempting to do a nonstop, single-handed circumnavigation of the Arctic. That's where this all sort of came out of. I tried in 2018, but you couldn't get the Russian permits. And the Russians were the problem in the end [this year]. I got defeated by Russian bureaucracy, essentially. And there was some weird stuff going on with the ice up there this year. [Editor's note: Sections of the High Arctic were impassable due to a relatively cold summer and solid ice fields.]
Rutherford's route took him close to Russia's coast, where the FSB intercepted him. (Image credit: Ocean Research Project)
SP: What happened with the Russians that forced you to turn back?
MR: The FSB got me. [Editor's note: The Federal Security Service (FSB) is Russia's main security agency and a successor to the Soviet Union's KGB.] They boarded me twice, actually. I've never been boarded in the ocean in my life, and I've been sailing 20 years, all over the place. I got about 1,000 miles [1,600 kilometers] into Russia, roughly. I got into the Northern Sea Route. If you just draw a line due north, I was due north of West China — it was way over there, about halfway around the world in the Arctic. I made it about halfway, because I started in Aasiaat, Greenland.
They boarded me once, and then they turned me around and boarded me again. It's a bit of a strange situation, I guess. Two days after I turned around, the ice that I was waiting to open opened, and I sent them an email — the NSRA, the Northern Sea Route Association in Moscow — and said, "Hey, it's open. Can I pretty please go?" And they just got mad at me, like, "You'll be in violation of your permit; you have to turn around."
SP: You're planning to try the circumnavigation again next year. Will you do anything differently to make sure you complete it?
MR: The boat's pretty good to go — which is great, because that's a huge time sink. Ideally, hopefully, if I can get north of [the Norwegian archipelago] Svalbard again like I did this year, then I'm going to stay north of [the Russian archipelago] Franz Josef Land, and I'm going to basically ride the polar ice cap all the way from Svalbard to the Northwest Passage — all the way to Alaska and beyond, essentially.
Because I've learned how the FSB operate, and I know where they're keeping their ships now. Even though I was north of Novaya Zemlya, they still were able to get me. But if I'm over there, north of Frank Josef, they don't go that far, so they won't be able to get me up there. I've figured out a couple of other things that I'm not even going to say, honestly — there are workarounds to get them to [leave me alone]. I'm going to go a little bit quiet.
The NSRA gives you the permit to do this, but the FSB are the people who patrol it. And the FSB don't like the NSRA. I learned that when they boarded me, because they think that they're the ones who should control the Northern Sea Route, not the NSRA. So there's [a] beef between them; they don't talk. There's a lack of communication, which benefits me. I can lean heavy onto the NSRA side, because they don't have boats; they're not going to board you. And they're the ones you have to check in with every 24 hours in Moscow; you've got to send them an email every 24 hours. So I'll do all of that stuff with those guys, but I think there's some ways I can avoid the FSB even knowing where I am, essentially, while still complying with my permit in the NSRA.
Basically, I've got to do the Northern Sea Route without getting within 12 miles [19 km] of any Russian land, period — even a little island, even a rock that sticks out that's 10 feet by 10 feet [3 by 3 m]. That's going to be real tricky, because there are a lot of little islands down there. But the FSB is mostly on the European side; they have almost no boats over on the east side or the middle. So if you can get past the European side by hugging the coast way the hell north, hopefully I can get past where they patrol, and then I can just shoot on through.
Nobody else in the world does this — nobody else in the Arctic, nobody else anywhere. There's literally no other body of water on Earth where you've got to get permits, and then you've got to get boarded like this. It's only Russia, and only north of Russia. And that's because there's a huge amount of natural gas, they think, buried above Russia. So Russia's trying to claim everything to the North Pole.
Technically, it's international waters, so the U.N. is like, "No, this is not right." And Russia's like, "Whatcha gonna do about it?" It's kind of hard to argue with that — and it's north of Russia, so nobody else is there. They've got free rein, and they've got all the icebreakers and whatever else.
Everything else is about the same. I need to secure my hot sauce better, because every time I open my cabinet, they fall out all over the place. There's little things like that — quality-of-life things. I'll probably bring some more heated socks — electric socks and electric gloves. I'll try to make better videos — but I'm not a content creator, and I don't want to be an influencer.
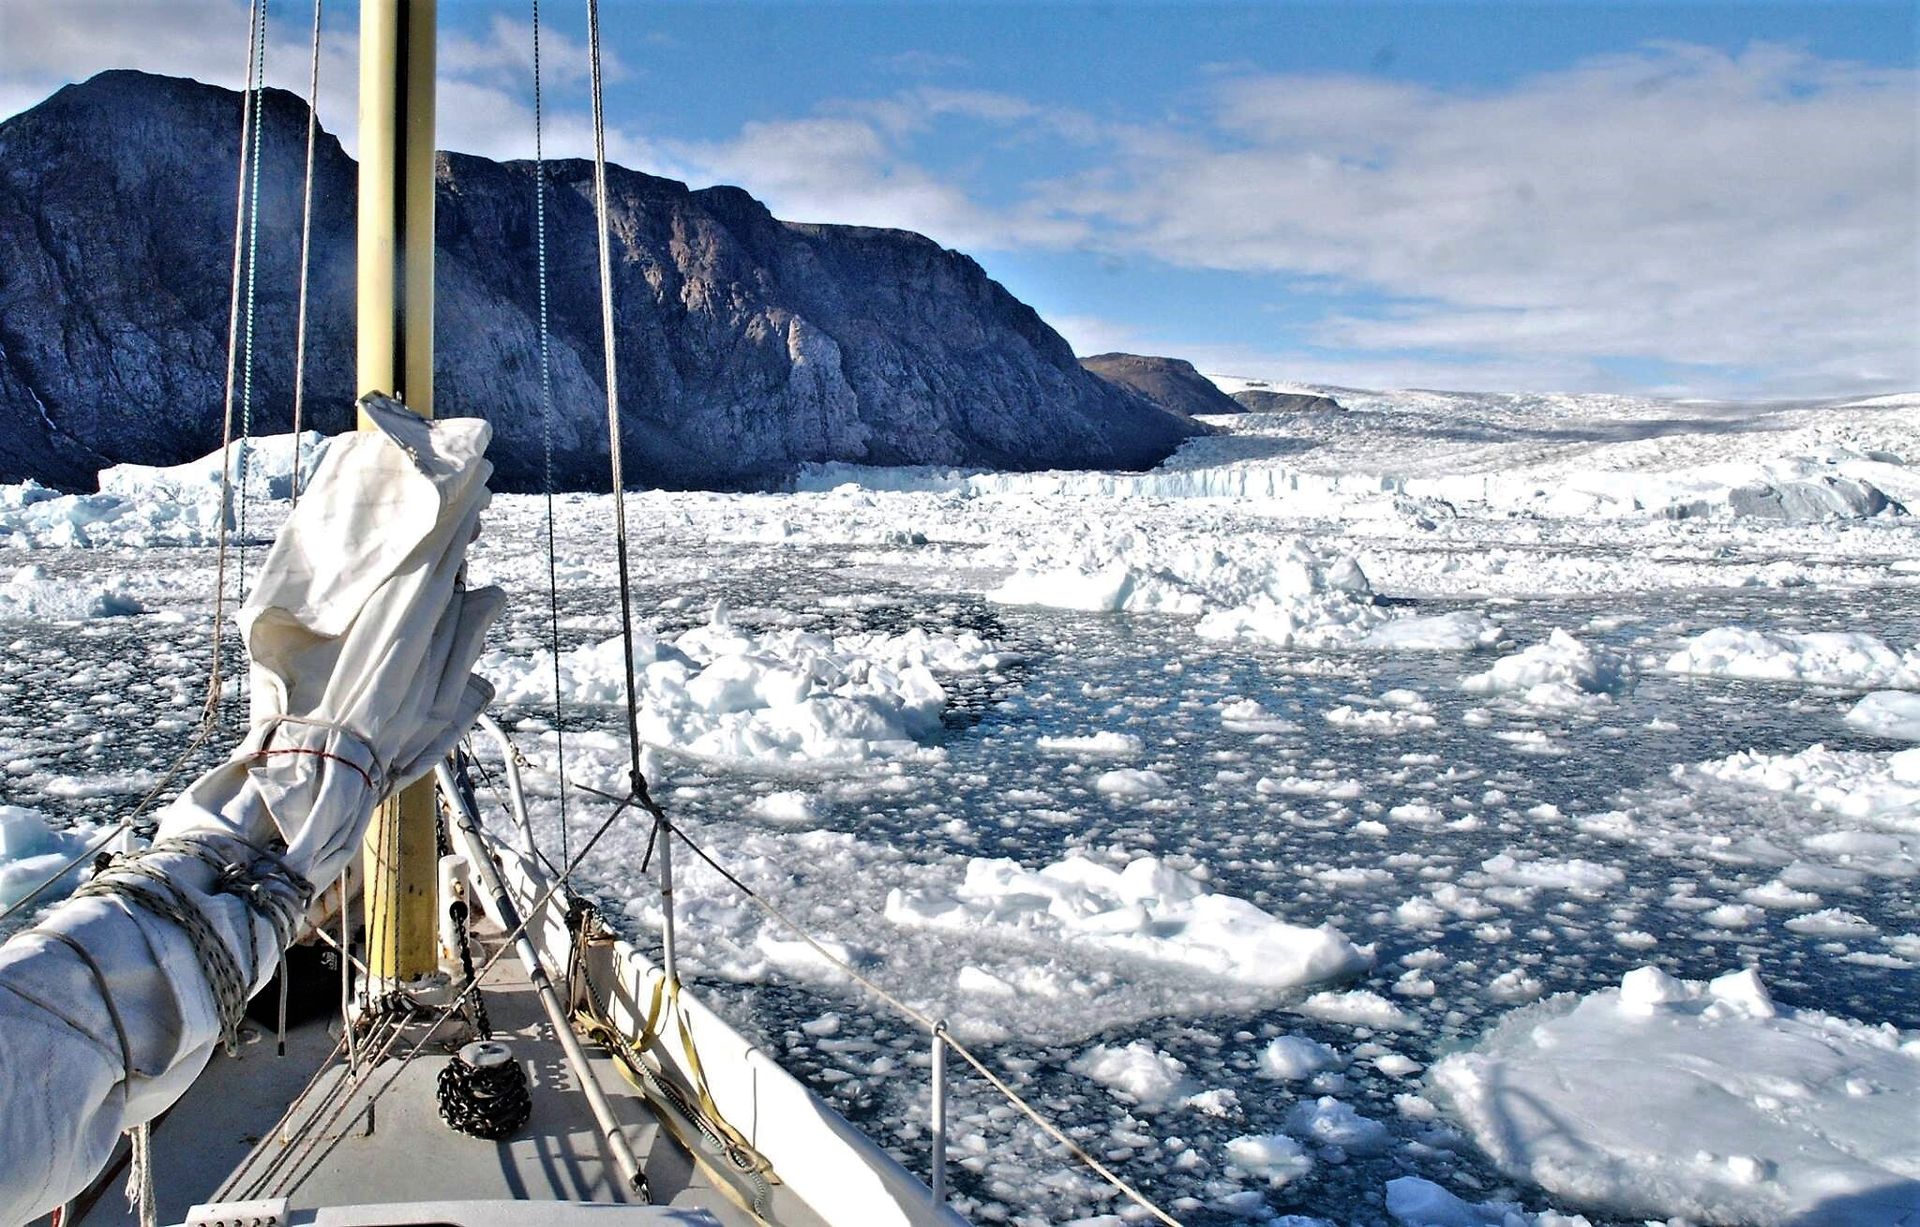
Rutherford will make another attempt at circumnavigating the Arctic next year. (Image credit: Matt Rutherford)
SP: Can you tell me a bit about your background and what led you to this point?
MR: I did this whole circumnavigation of the Americas — nonstop, single-handed — back in 2011 where I spent 309 days alone at sea on this little 27-foot (8 meters) boat. When I got back from that big, crazy trip — which I made a documentary about ["Red Dot on the Ocean: The Matt Rutherford Story"] — I created a nonprofit called Ocean Research Project, where, basically, we use sailboats to do research. We focused mostly in 2013 and 2014 on garbage-patch-related microplastics. In 2013, we mapped out the eastern side of the Atlantic garbage patch, because nobody had got to the eastern side of it. I think it was 160,000 pieces per square kilometer, or something like that. And then, we did some stuff in 2014 in the Pacific garbage patch with the University of Tokyo; we did a joint paper with them.
But mostly what we focus on is Arctic research. Since 2015, we've been heading up to Greenland — sometimes the Northwest Passage also, but primarily Greenland — doing research related to glaciers, for the most part. An ocean-terminating glacier sort of has a river of melted water underneath it, and it creates upwelling, and the upwelling has nutrients. So it mixes nutrients with the ocean and creates this perfect recipe for growth for phytoplankton and zooplankton. And then, we look at the different stages of decay between an ocean-terminating glacier, a land-retreated glacier or a deglaciated fjord. In the middle phase, when a glacier starts retreating back on land, it just creates a river of muddy water, essentially; it turns the fjord into a mud puddle. You can't have photosynthesis if you're in a mud puddle.
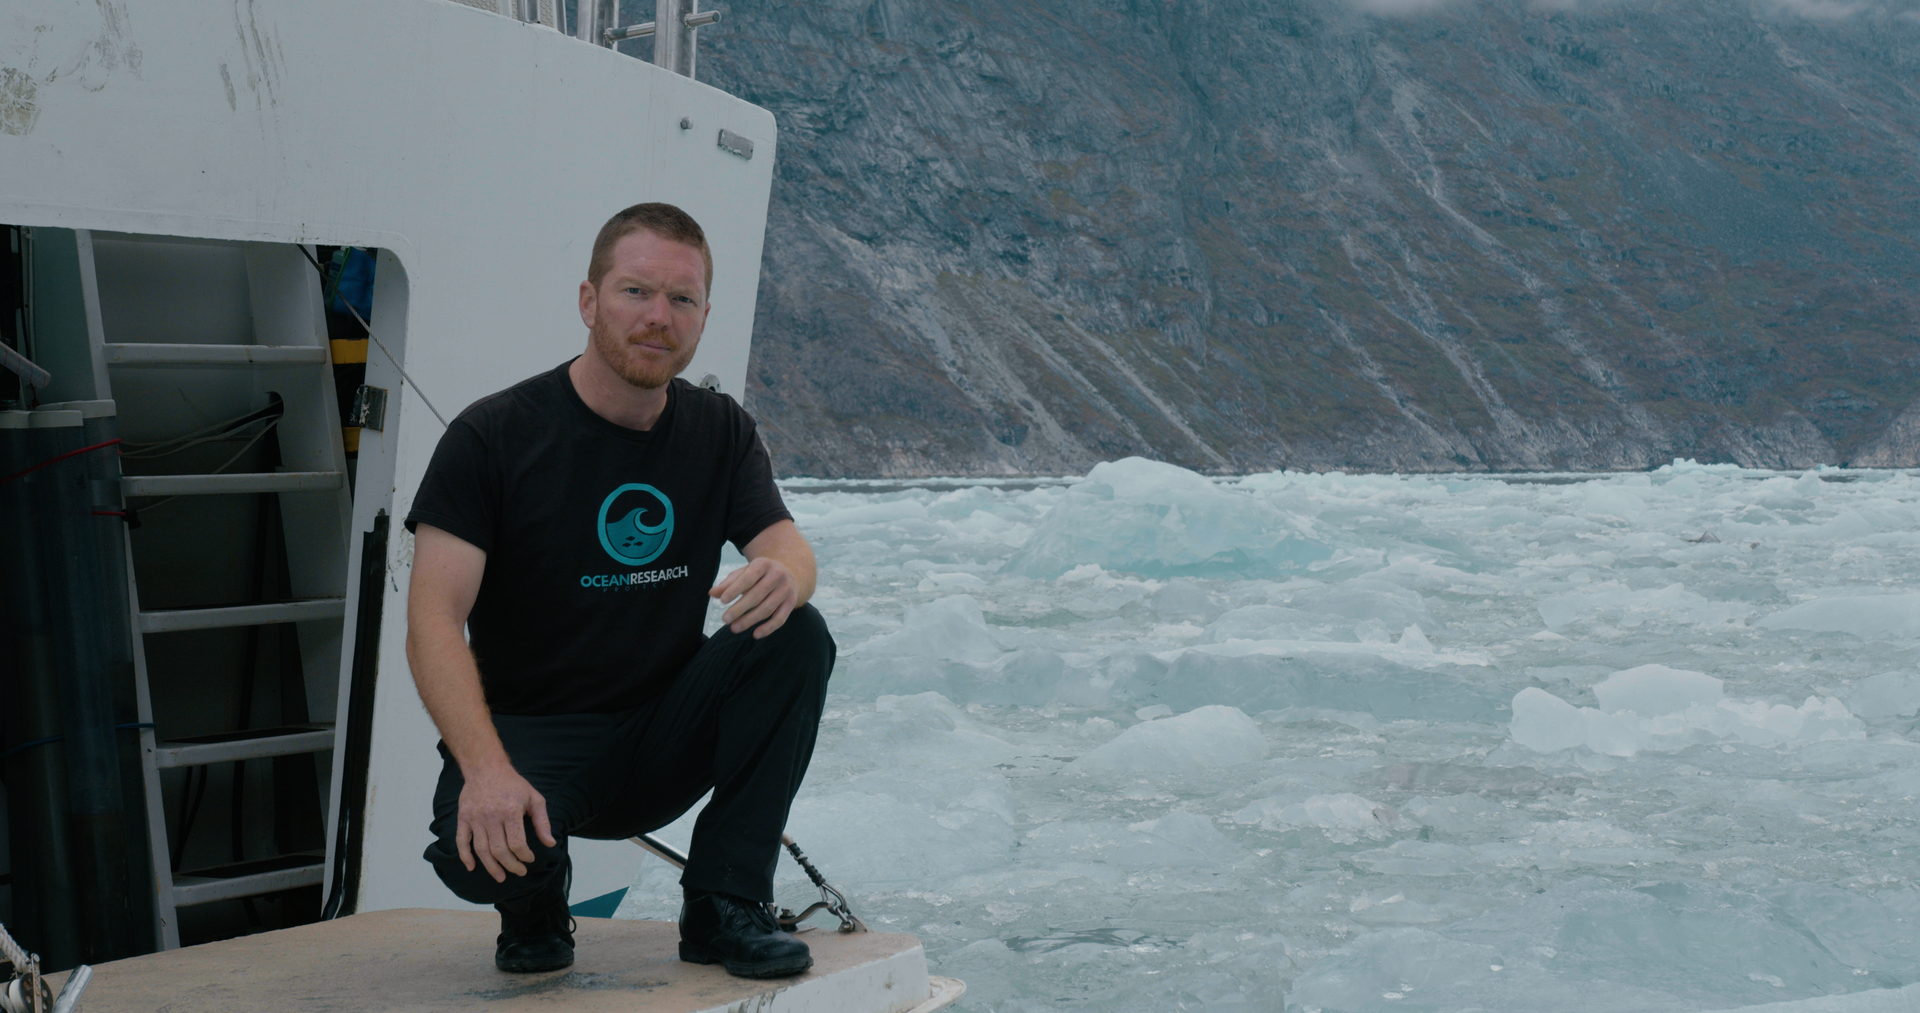
The Ocean Research Project is a nonprofit studying the Arctic and Chesapeake Bay. (Image credit: Matt Rutherford)
SP: Have you been collecting samples or data on this expedition?
MR: Well, it's a little tricky on a boat under these circumstances. I took 50 samples, which were just water samples, and those were from Newfoundland to Aasiaat, Greenland. Nicole [Nicole Trenholm, Ocean Research Project's science director] has a NASA internship out at JPL [Jet Propulsion Laboratory]. She was publishing a paper looking at their model that they have [ECCO-Darwin], and I've kind of forced my way into the paper — well, the organization did, with Nicole's help — by adding these samples. Now we have in situ data, physical data, that we can compare to the model data. That was the only thing we did this year. It's a couple-thousand-mile stretch with 50 water samples in it, so it's a pretty straightforward sort of thing.
Nicole is trying to publish multiple peer-reviewed scientific papers from our previous data. She's got a traffic jam of data, so she needed some time to finish publishing papers from stuff we've collected over the last few years. There is no money anyways. I could still grab some samples on the way up there [Greenland]. And it's trying to promote the nonprofit through it, because people will pay a lot more attention to this stuff than they pay to traditional research expeditions.
SP: What are your hopes for the Ocean Research Project once you tick off this goal?
MR: Basically, we're trying to expand the organization over the next couple of years. I'd like to bring in another one or two more scientists, because we're up there for three months in Greenland, and sometimes we go to the Northwest Passage — and it's a lot for one scientist.
The big problem we're having is that when Elon Musk was part of DOGE [U.S. Department of Government Efficiency], they cut a massive amount of polar funding — something like 88% of it — because apparently climate change is a hoax and they hate it and you're not allowed to research it either, right?
Basically, nobody's got money. We don't typically get NSF [National Science Foundation] funding; we get more foundation funding, because it's hard to get NSF funding, even before all this stuff. Now that the funding has been cut on the governmental level, a lot more scientists are going after the foundation grants that we used to have a lot less competition for. That makes it a little tricky, too, because now they're getting a flood of requests that they didn't usually get in the past.
This interview has been condensed and edited lightly for clarity.
Last year's massive earthquake in Myanmar could help researchers better predict where the worst shaking will be if the "Big One" hits the San Andreas Fault in California.
The magnitude 7.7 quake hit on March 28, 2025, near the city of Mandalay and shook buildings as far away as Bangkok, 830 miles (1,330kilometers) away. The death toll was at least 3,700 people. New research that used detailed satellite data and a one-of-a-kind video of the ground rupturing reveals that the fault had a twisty, almost helical shape, which affected the shaking.
The Sagaing Fault in Myanmar that triggered the quake is analogous to many strike-slip faults worldwide that threaten population centers, said Alice-Agnes Gabriel, a geophysicist at the Scripps Institution of Oceanography at the University of California, San Diego and co-author of the new research, which was published Oct. 14 in the journal Nature Communications. This includes California's San Andreas Fault, which is similarly tilted and likely capable of generating a 7.8 magnitude earthquake. Studying what happened as the ground ruptured near Mandalay can reveal what might occur in future earthquakes on similar faults, Gabriel told Live Science.
"The idea is, we cannot predict when and where an earthquake might happen" along a particular fault, she said, "but we may be able to predict certain aspects of it."
Gabriel uses powerful supercomputers to model earthquake scenarios, but these scenarios are only as good as the data that goes into them. In the case of the Myanmar quake, the researchers had a unique piece of data to ground-truth their model on: a security video of the ground crackingas the fault ruptured. This phenomenon had not been captured on video before.
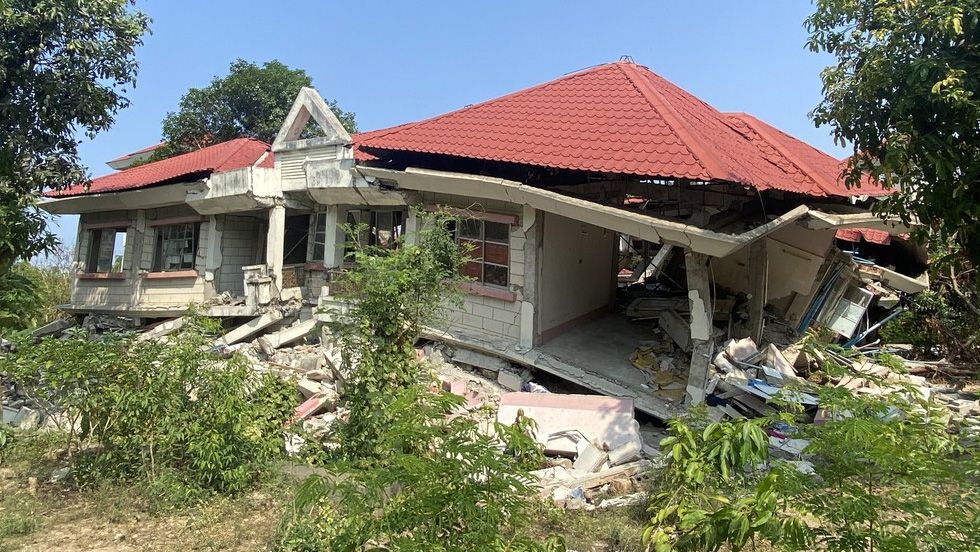
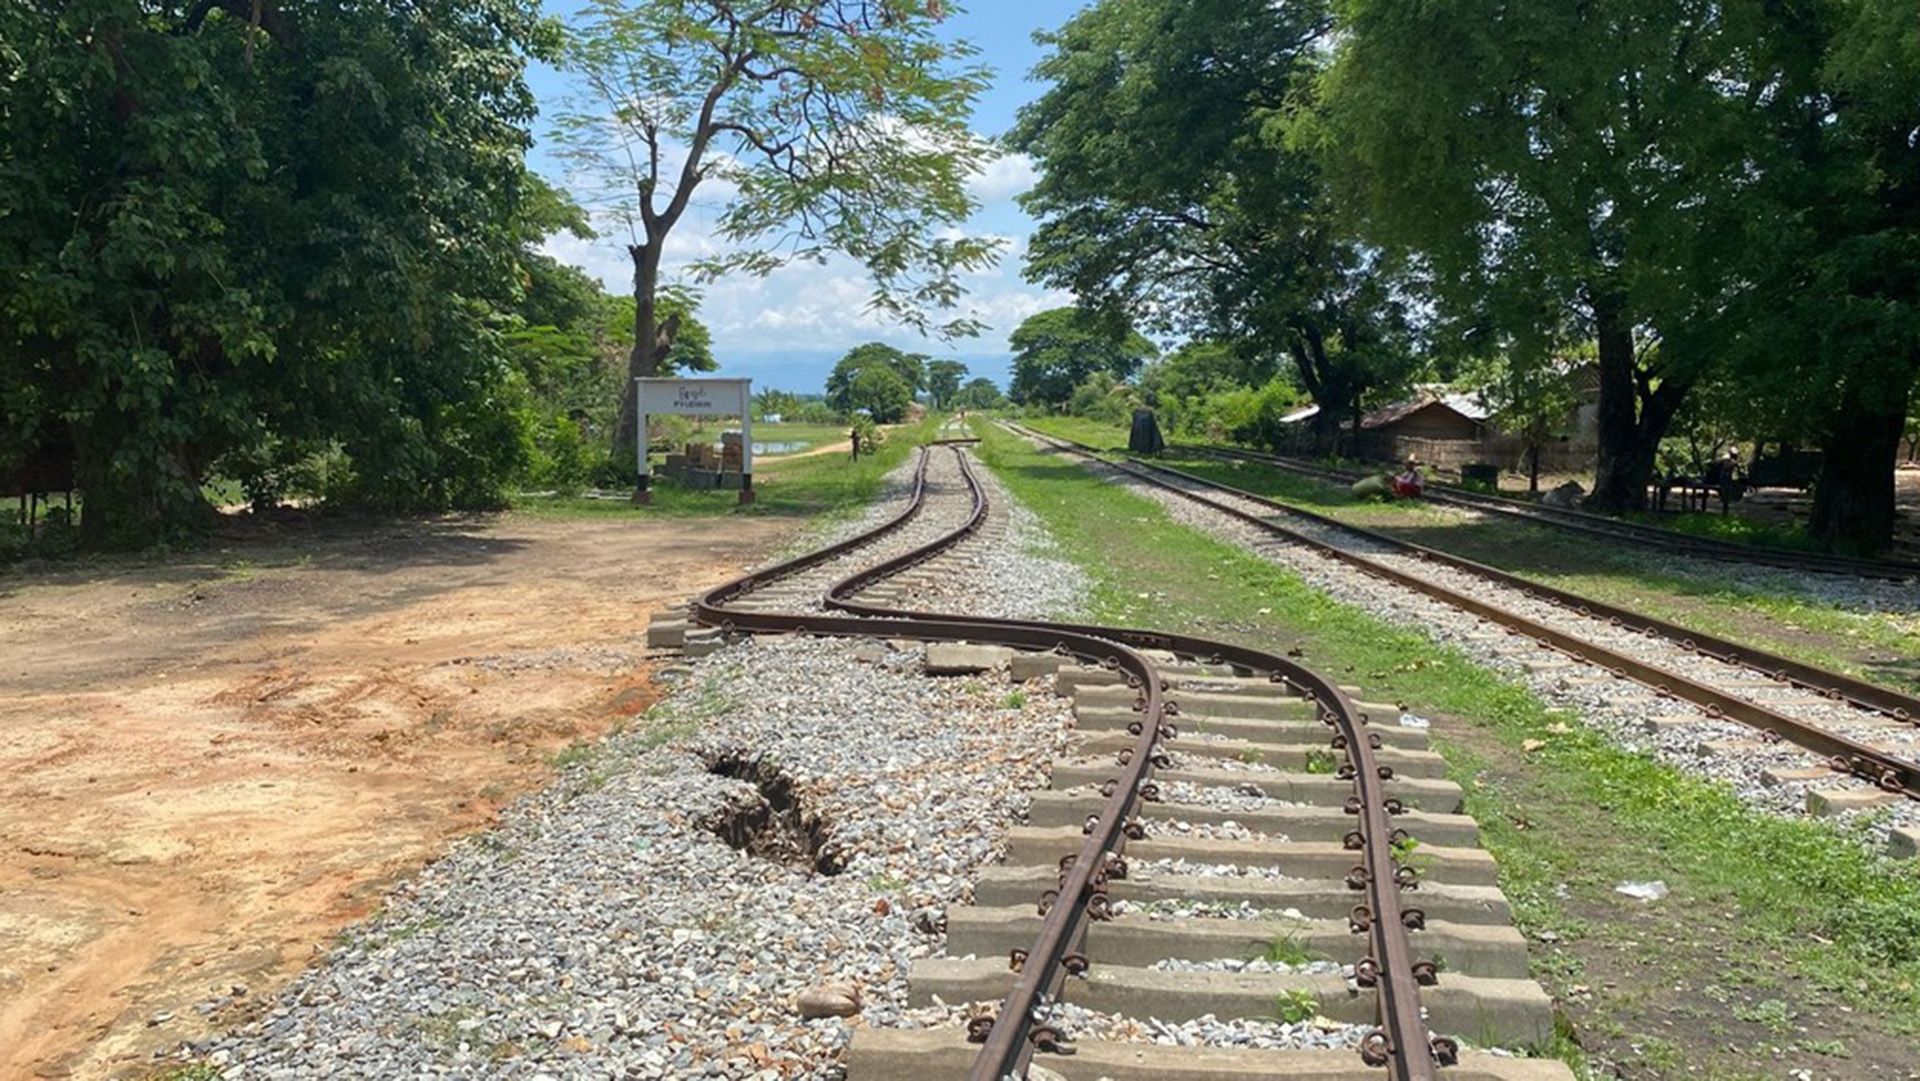
Damage from the magnitude 7.7 earthquake that hit on March 28, 2025, near the city of Mandalay. (Image credit: Photo(s) taken by Dr. Tha Zin Htet Tin of East Yangon University)
The researchers' models revealed that the fault is not a vertical plane under the ground. Instead, the surface dips west on the northern end of the fault, becomes vertical in the middle, and then dips eastward at the southern end, they found.
In general, more shaking occurs in the direction in which a fault line dips, Gabriel said. In the case of the San Andreas Fault, the dip is inland, toward California's high desert — an area that's less populated than coastal regions on the other side of the fault. This means that, if the Big One acts similarly to the Myanmar quake, the high desert side of the fault will experience more intense shaking than the coastal side. The San Andreas Fault has also built up strain for over a century, so the researchers believe it could act in a similar way to the Sagaing Fault.
However, everyone near a dangerous fault should still prepare for major shaking, Gabriel warned, because small local variations, like how much sediment has accumulated over the bedrock in an area, can make a difference in how bad the ground movement gets. Los Angeles, for example, sits on a sediment-filled basin that would jiggle like jelly in a large quake.
The researchers also investigated whether they could have predicted aspects of the Mandalay quake from monitoring data they had available from before the quake. They knew that the Sagaing Fault had been "locked" in certain segments, meaning that while the two tectonic plates on each side of the fault were moving, the rocks at the fault line were jammed against each other. These locked segments had been accumulating strain for 186 years.
The researchers found that they could predict the path, shape and speed of the rupture on the Sagaing Fault in Myanmar with details available prior to the quake, such as the detailed shape of the fault deep underground and how long sections had been locked. Similar predictions could be made for the San Andreas and other important faults. Previous studies have also shed light on other aspects of the fault, such as its simplicity and maturity, that could inform what might happen at other faults around the world.
Researchers are currently working to update their model of what the Big One would look like on the San Andreas. The results of the update will be shared to help the public prepare, inform building codes and educate emergency managers.
"This really shows how we can use this long-term fault-monitoring data," Gabriel said.
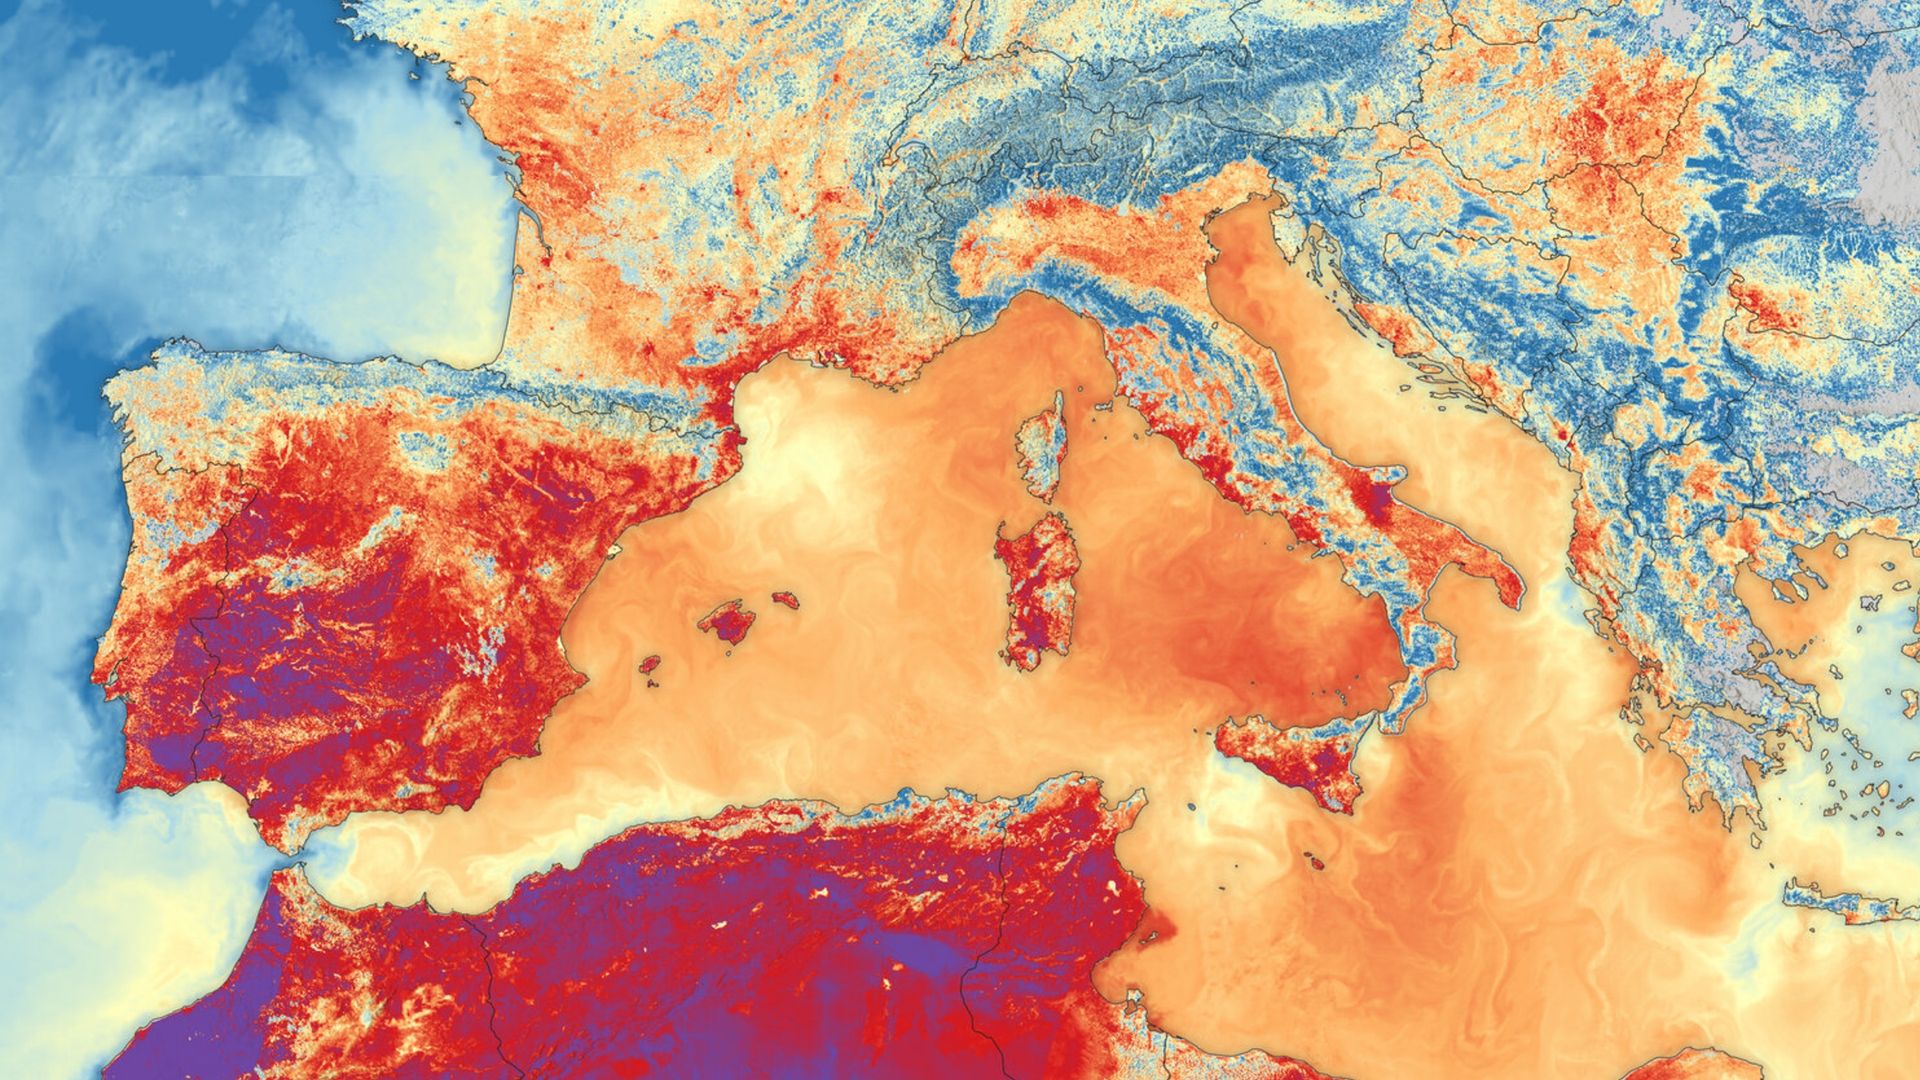
What's in the photo? Land and sea surface temperatures during one of Europe's record-breaking summer heat waves
Which satellite took the photo? Sentinel-3B
When was it taken? June 23, 2026
This striking satellite snap shows the scorching land and sea surface temperatures that hit Southern Europe during one of the continent's record-breaking heat waves this summer.
The image was created using data from the Sea and Land Surface Temperature Radiometer (SLSTR) on board the European Space Agency's (ESA) Sentinel-3B satellite. It was selected for this week's edition of Earth from space by Simonetta Cheli, director of Earth observation programs at ESA and head of the European Space Research Institute (ESRIN) in Frascati, Italy.
Live Science recently visited Frascati to see ESRIN's newly operational Space HPC supercomputer and sat down with Cheli for an in-depth discussion about Earth observation. When asked about her favorite satellite image, Cheli highlighted this photo as one that caught her eye this year.
In the thermal image, dark reds highlight terrestrial temperatures in excess of 95 degrees Fahrenheit (35 degrees Celsius) across most of Spain and parts of France and Italy, while dark purple spots show highs above 104 F (40 C) across patches of Spain and North Africa. The image also reveals sea surface temperatures spiking across the Mediterranean Sea. (The colors in the image do not represent the same temperatures on land and sea. For example, orange indicates temperatures of around 86 F (30 C) on land but around 73 F, or 23 C, at sea.)
Cheli said that assessing how terrestrial and marine environments interact during extreme weather events is really important and that including both in the same image is the only way to appreciate the true scale of this heat wave: "You see the red in the sea, and you see the red on the land, and I think it gives the feeling of the heat wave that we've all been living through this summer," she said.
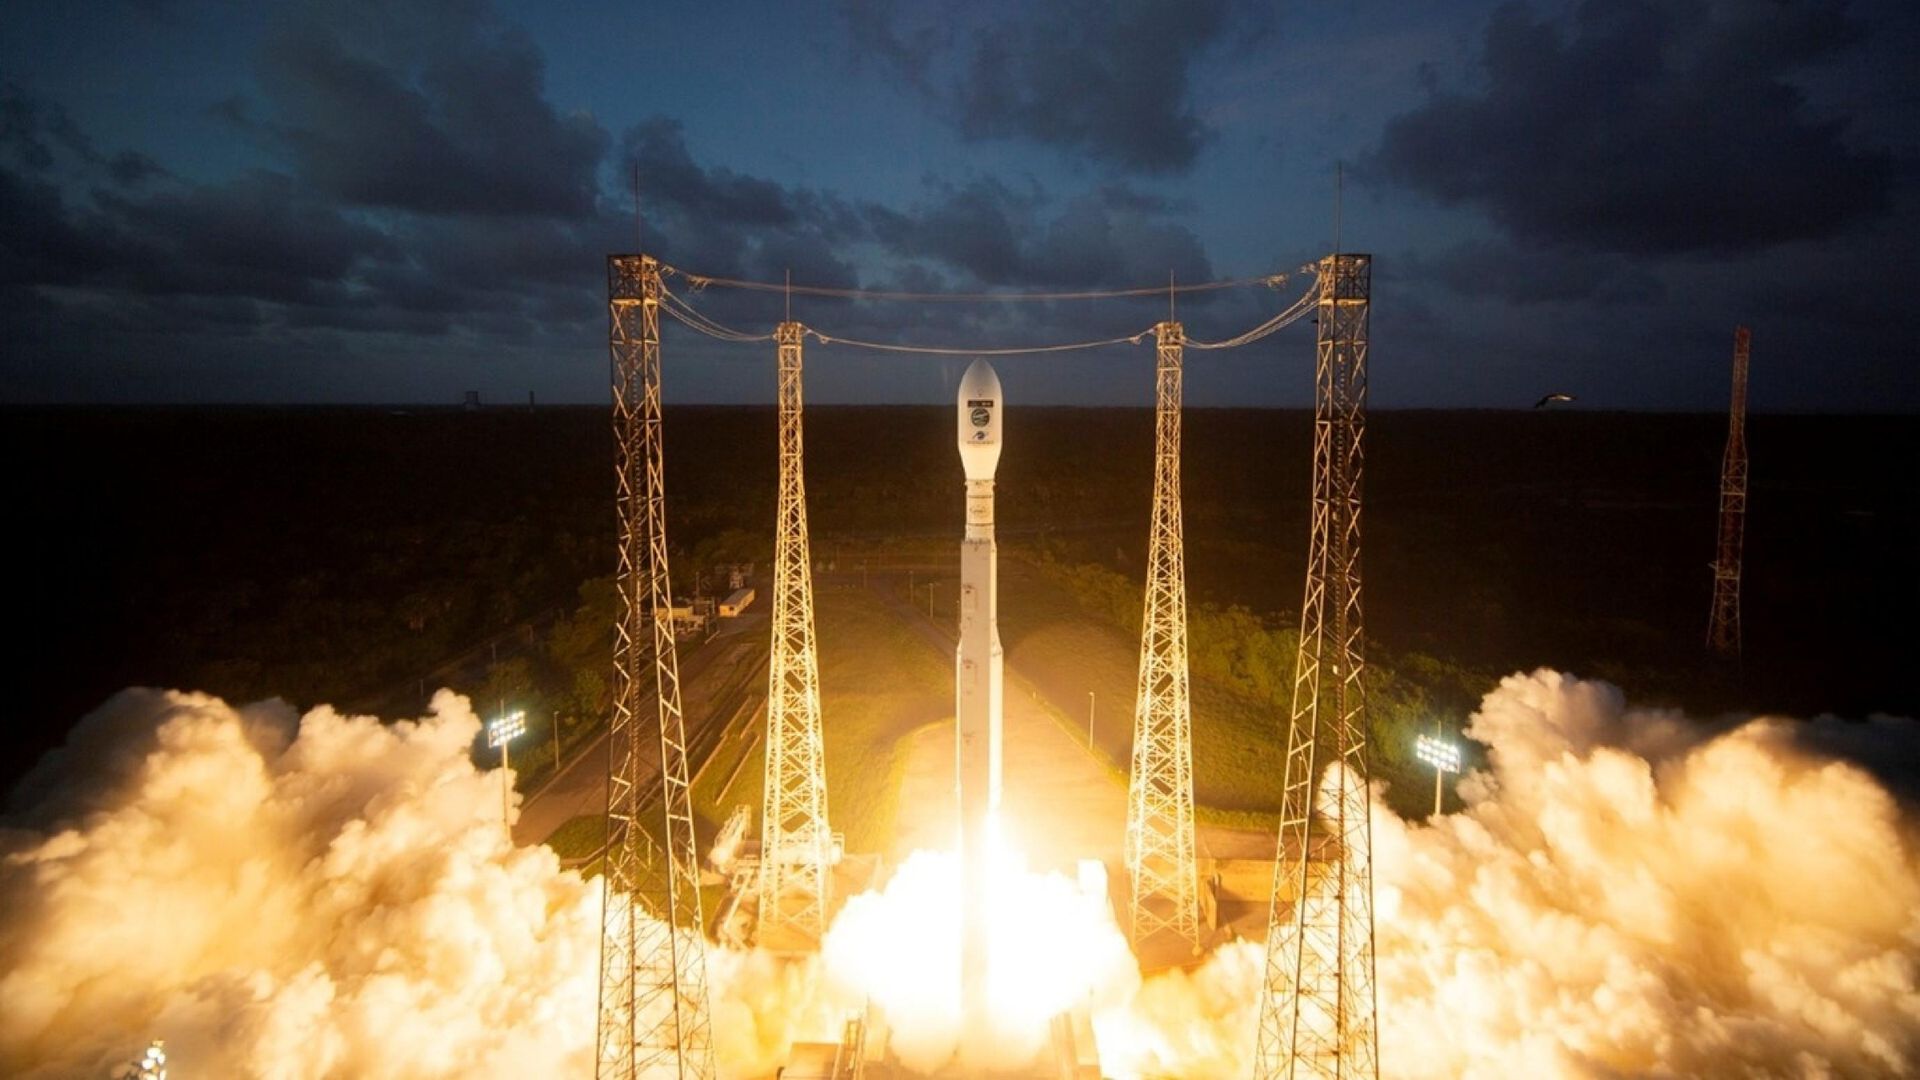
ESA launched the Sentinel-3C satellite in September, on board a Vega rocket that lifted off from the agency's launch site on French Guiana. It will help the agency monitor future extreme weather events in even greater detail. (Image credit: European Commission)
While many people may find such images related to human-caused climate change disheartening, Cheli sees it as a sign of hope that orbiting spacecraft can monitor otherwise-invisible changes to our planet's surface in such detail.
"It makes me feel that we can do a lot about it," she said. "It makes me feel that we have tools and certainly information capabilities to support, help and also raise awareness about this topic."
Cheli told Live Science that ESA's ability to monitor extreme weather events like this will only improve as the agency launches new-and-improved spacecraft into orbit. In September, ESA successfully launched Sentinel-3C, the successor to the spacecraft that snapped this image, which has already captured its first photos of Earth and will help study future heat waves in greater detail.
Europe's record-breaking summer
Between late May and mid-August, parts of Europe were hit by at least five separate heat waves, meaning temperatures stayed unusually high throughout the season. "We had, I would say, the hottest summer ever," Cheli said.
The peak heat occurred in June, when the average temperature for that month reached 69 F (20.7 C) — its highest in Western Europe's recorded history, according to the World Meteorological Organization. (This average includes nighttime temperatures, which is why it seems relatively low compared to other temperatures mentioned so far.)
Eight countries — Austria, Belarus, Czechia, Denmark, Germany, Hungary, Poland and Slovakia — recorded their highest land surface temperature of all time at various points throughout this summer, and several others had record temperatures for a specific month or region.
The extreme weather caused widespread droughts across the continent, some of which are still ongoing, and helped trigger several wildfires, including a series of particularly large blazes in France. Experts think the high temperatures resulted in at least 35,000 excess deaths across Europe, although the true number is expected to be much higher, according to The Guardian.
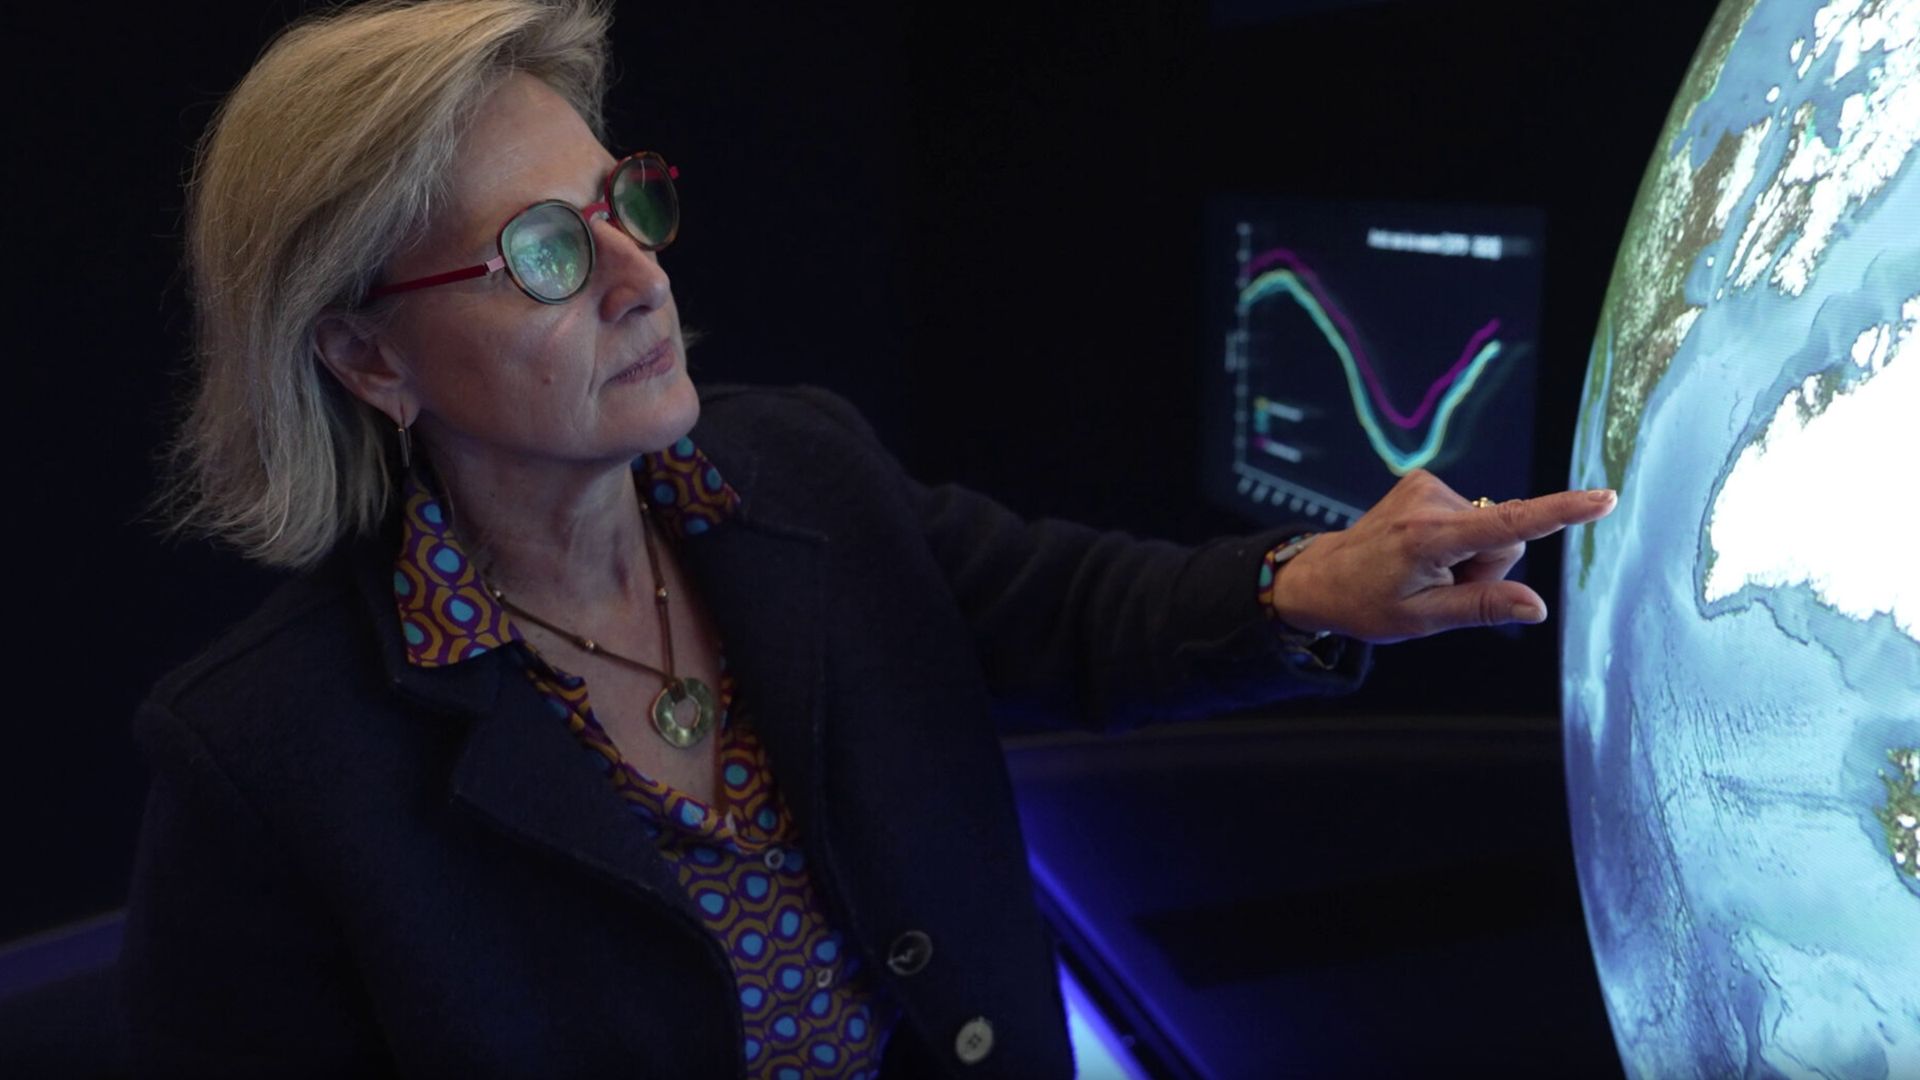
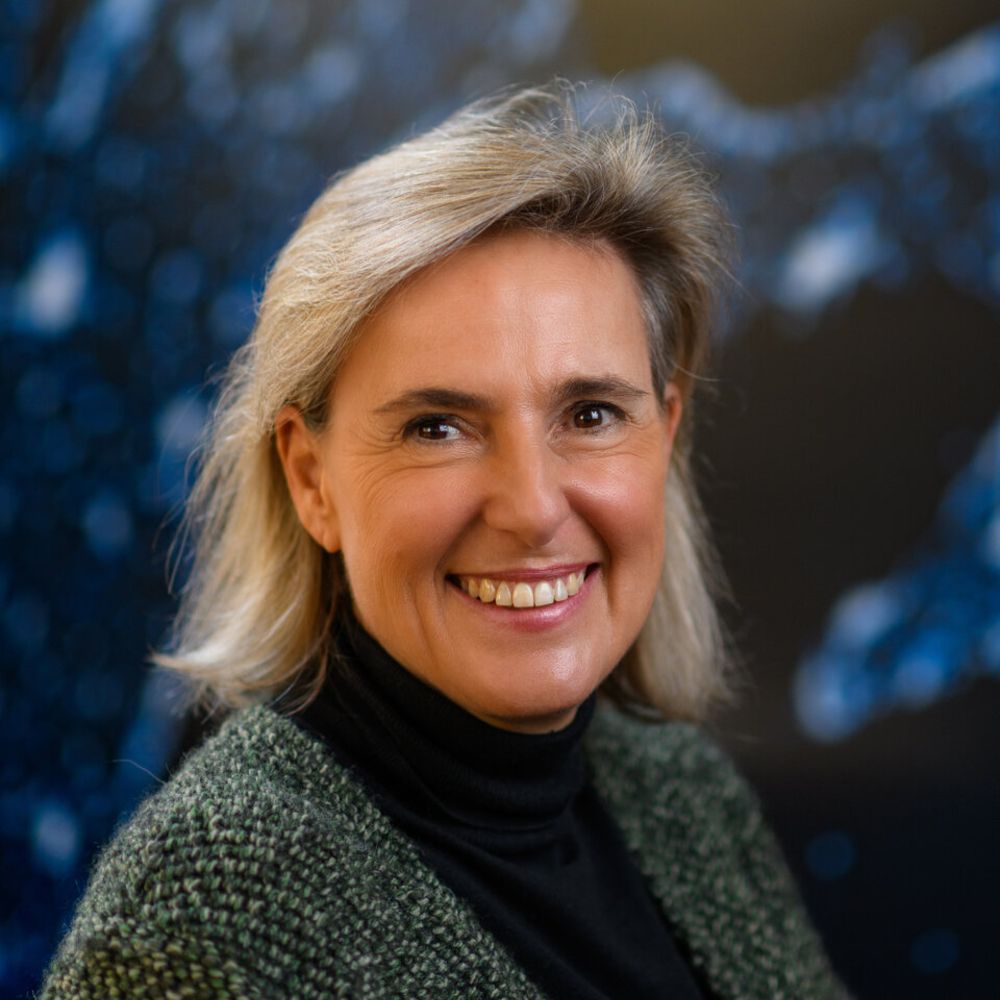
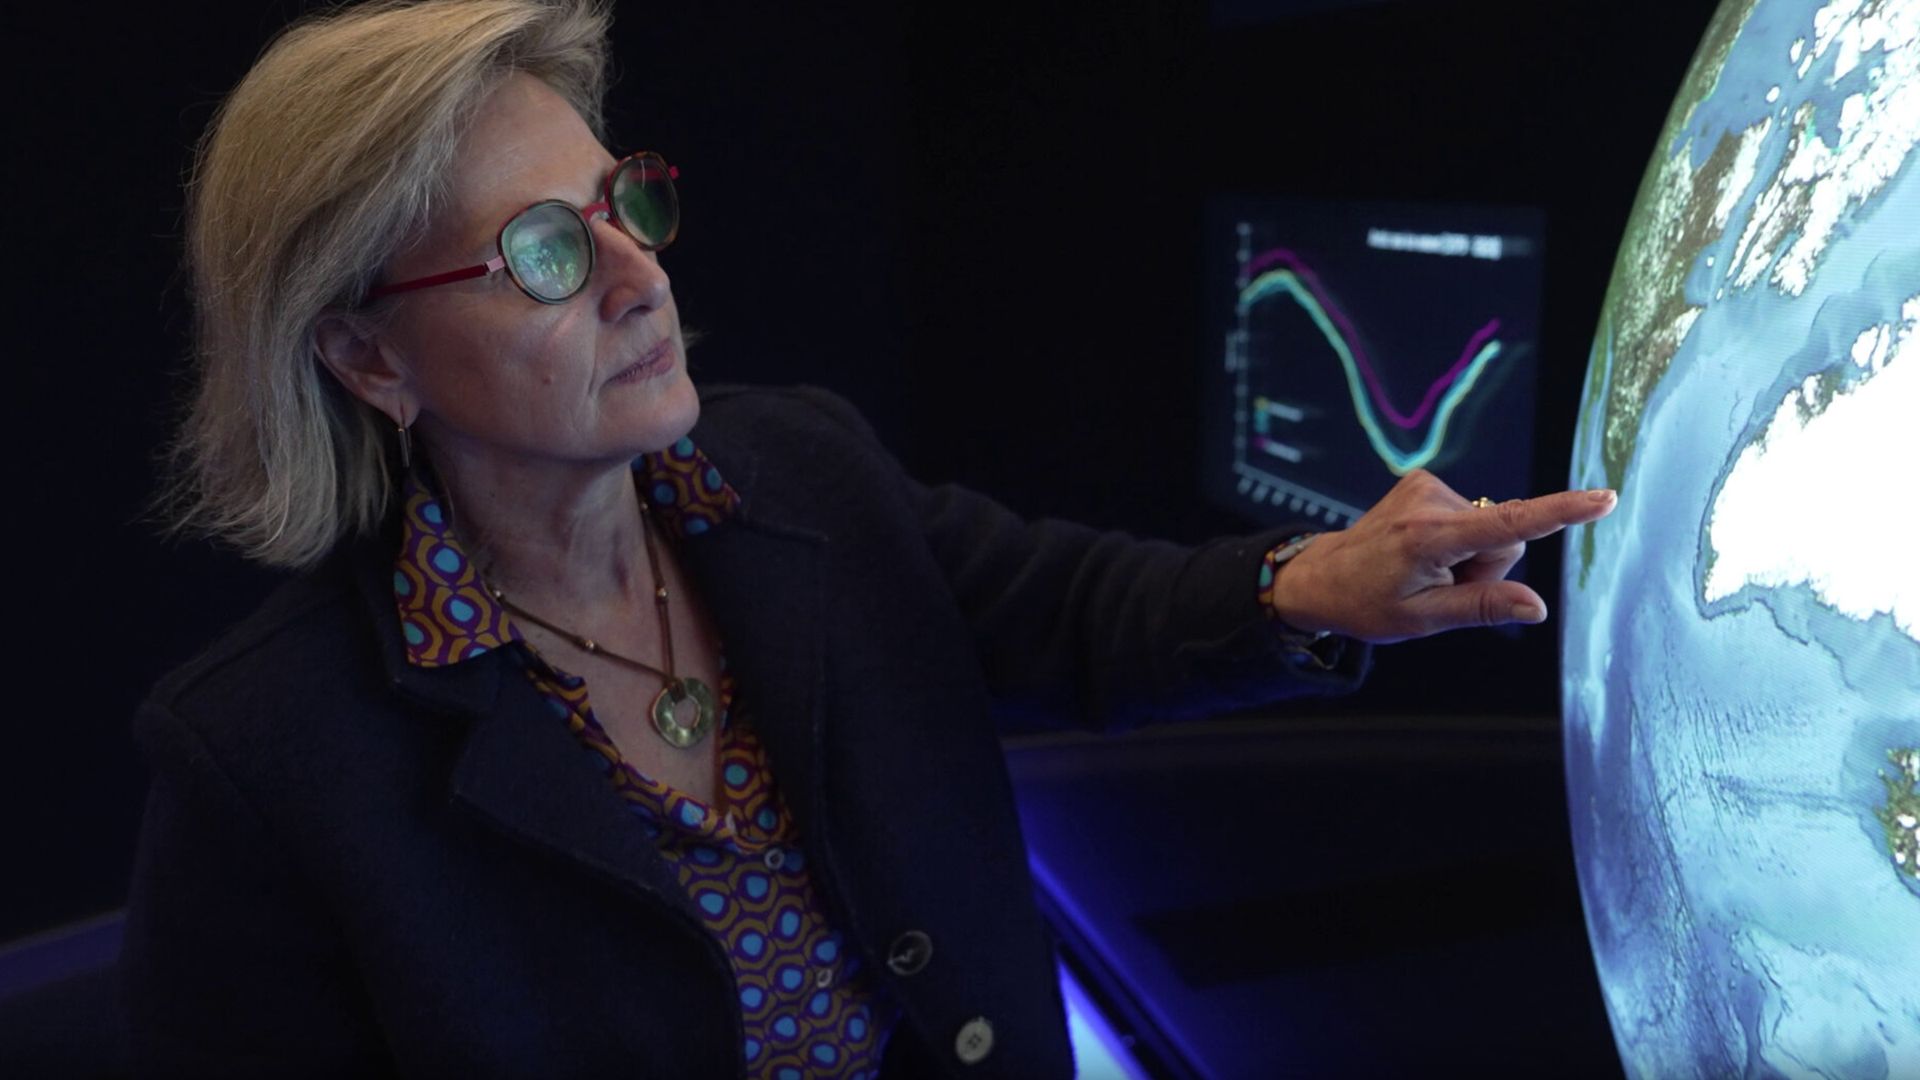
Simonetta Cheli is the director of ESA's Earth observation programs, and has been working at the agency for nearly 40 years. She described this summer's heat waves as the hottest she can remember. (Image credit: ESA)
The heat waves were caused by "heat domes," which are pockets of high pressure in the atmosphere that trap warm air beneath them, like placing a lid on top of a boiling pot. These are also linked to higher sea surface temperatures.
FRASCATI, Italy — Observing Earth from space provides a much-needed insight into the evolution of our planet's health. This is particularly important in the face of climate change, as environmental degradation, food insecurity and extreme weather events can all reveal themselves in stark images taken from high above our planet's surface.
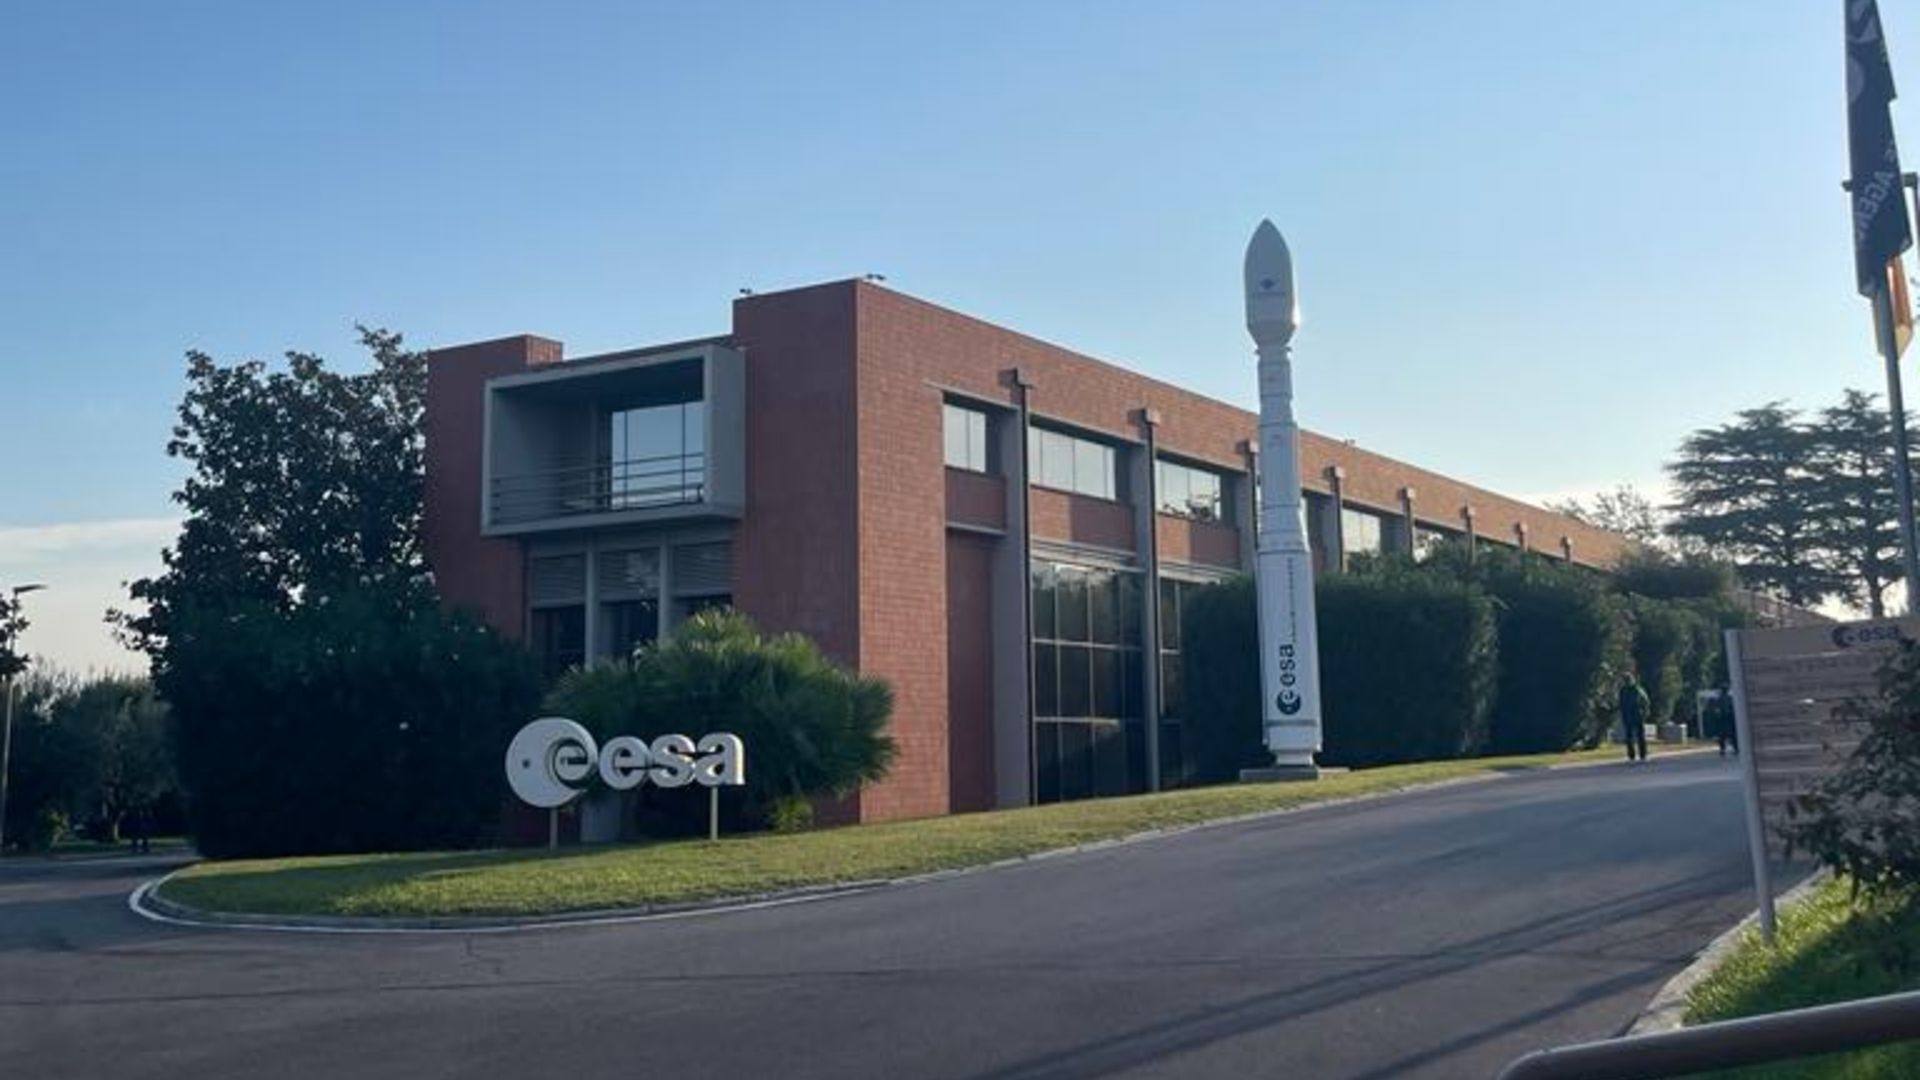
Simonetta Cheli is the director of Earth observation programs at the European Space Agency (ESA) and the head of the European Space Research Institute (ESRIN) in Frascati, Italy. With nearly 40 years of experience in the field, she is one of the world's leading experts on Earth observation.
Live Science spoke with Cheli on a recent visit to ESRIN to talk about why Earth observation is so important, how NASA budget cuts and political changes have altered the picture, and why private space satellites risk our ability to view the planet clearly.
She also discussed how new supercomputers, like ESRIN's newly operational Space HPC, are helping to process vast amounts of data like never before — and shared her favorite recent satellite snap of our planet
Simonetta Cheli became ESA's director of Earth observation programs and head of ESRIN on Jan. 1, 2022, more than three decades after joining the agency. She was born in Siena, Italy, and went on to study law and economics at Yale University before gaining a degree in political sciences at the University 'Cesare Alfieri' in Florence, Italy. She also holds a diploma of advanced studies from the Centre d’Etudes Diplomatiques et Stratégiques in Paris. (Image credit: ESA)
Harry Baker: Why is observing Earth from space so important?
Simonetta Cheli: It's important because we need to know today what is the state of our planet, if it's healthy or if it's in danger, if it's stressed or not.
It's important to have objective information on many different variables, such as deforestation, the quality of the air that we breathe, the evolution of the oceans or the melting of ice masses. Basically, we need to be aware of what the situation is on Earth today, so we can preserve it tomorrow.
HB: How has ESA's Earth observation program changed throughout your career?
SC: When I started at ESA [in 1988], we were relying on missions from partners, including the Americans and Japanese. We didn't have our own missions.
We launched the first mission [ERS-1] in 1991. Today, just here at ESRIN, we manage over 20 missions and are planning more than 40 more. We have also launched three different missions in the last three weeks — one to look at how oceanography impacts extreme weather events [International Report for an Innovative Defence of Earth]; one to monitor the fluorescence and health status of vegetation [Fluorescence Explorer]; and one to measure temperature on land and sea [Sentinel-3C], which was a super useful thing this summer.
Cheli is one of the world's leading experts on Earth observation and currently oversees more than 20 different missions that are monitoring our planet from above. (Image credit: ESA)
Europe is now a leading power in this domain worldwide. We have evolved a lot.
HB: How important is it to cooperate with other countries when observing our planet from above?
SC: Well, I must say, in ESA, it's in the DNA of our work. ESA includes 23 countries today, so we work together daily. We also work very closely with other commercial partners and the European Union, as well as international partners like NASA, Brazil, India and Africa. So this is part of our job, and very much also in the domain I'm managing.
We used to go to the climate conferences together. We are not anymore.
Simonetta Cheli, ESA
To tackle climate and environmental stability, you cannot just do things alone at the national level. You have to share data and work with everybody in the world, where you have to have common objectives. For example, what happens to Greenland affects everybody on Earth, not just the people who live there. So the collaboration, I think, is very much inherent in our daily job at ESA and between our partners.
HB: Given the recent cuts to NASA's funding, including its Earth observation budget, does ESA feel a bigger responsibility to step up and fill the gap?
SC: I think we certainly have a bigger opportunity in the sense that today, with the systems we have and the satellites we have and the missions we have, even before the political context. For example, we were already leading the U.S. with data on emissions.
Live Science recently visited Frascati to see ESRIN's newly-operational Space HPC supercomputer. (Image credit: Harry Baker/Live Science)
We have a very good working-level collaboration with our American partners. This is somehow preserved, although politically it is, of course, more delicate. We used to go to the climate conferences together. We are not anymore.
HB: ESA just launched the latest batch of satellites in the IRIDE constellation (an Italian funded network of Earth-observing spacecraft designed and operated by ESA). What makes these satellites so special? And how are they helping your research?
SC: We launched the latest eight [satellites] last night! (The IRIDE satellites launched on Oct. 1, the day before this interview took place.)
Sixty-eight satellites are planned overall in this constellation, and we have launched quite a few [39] already, and plan to launch some more before the end of the year.
On Sept. 14, ESA also launched the Sentinel-3C satellite on board at Vega rocket that lifted off from the agency's launch site in French Guiana. (Image credit: European Commission)
The network will collect a lot of data from the optical radar spectrum that will support different user needs: for example, in the civil protection area, in coastal erosion monitoring, in coast guard operations and in environmental stress analysis. And so this system will certainly be a big contribution to the wider European Earth observation setup.
HB: The number of private satellites, like in SpaceX's Starlink constellation, is increasing fast. Are you worried about the impacts that this might have on your scientific spacecraft?
SC: We are worried because we see that the anti-collision maneuvers are increasing and increasing. When my mission manager tells me we have to move the satellite because there is a risk of collision with another satellite, we have to go check with ESO [European Southern Observatory] in Germany, and then the operations center moves the satellite. And the number [of times we've done this] has certainly increased in the last four or five years due to the increased number of satellites up there.
For the moment, the technical collaboration with partners is going quite well. So when we see someone else's satellite, we actually try to organize things as best we can, and technically it's working well. But what we need for the future is a clear framework at the legal level, which is engaging everybody.
"Everybody" in space is no longer only the institutional partners; it's not just the space agencies of the world that should engage. Today, you have private actors, like Starlink, and if they don't engage in the same rules, you risk having a delicate situation. But this is something that we are discussing daily, and we're tackling.
HB: The whole point of Earth observation is to protect our planet. How do you feel about some of the negative impacts of launching satellites, such as exhaust plumes, metal pollution and space junk?
SC: There is a very strong objective linked to sustainability at ESA. It is not just about using the data to better preserve our planet; it's also about being sustainable in the daily work we do.
Chelli has been working at ESA for nearly 40 years, and believes that global cooperation is essential in Earth observation. (Image credit: ESA)
This is linked to, for example, trying to have a space debris policy; trying to have enough propellant on board of the satellites that we build to make sure that once they finish their lifetime, they come back with a re-entry assist and they don't stay there in orbit. And the same is true in the launcher domain, where there's a very strong effort from our partners in French Guiana [where ESA's only active launch site is located] to lessen our impact as much as possible on the environment with the launch setup.
There's a really dedicated team doing all this.
HB: How will AI systems and advanced computers, like Space HPC, help researchers process data? And what sort of things could that help you do?
SC: We have today a wealth of data that is continually increasing. Just in the Copernicus program [Europe's biggest Earth observation initiative], we receive 500 terabytes of data per day.
We also have big volumes of data in the archives here at ESRIN from science missions of international partners, including Japan, India, the U.S. and others. This "heritage data" guarantees that archival data of missions that have ended are preserved, which is super important.
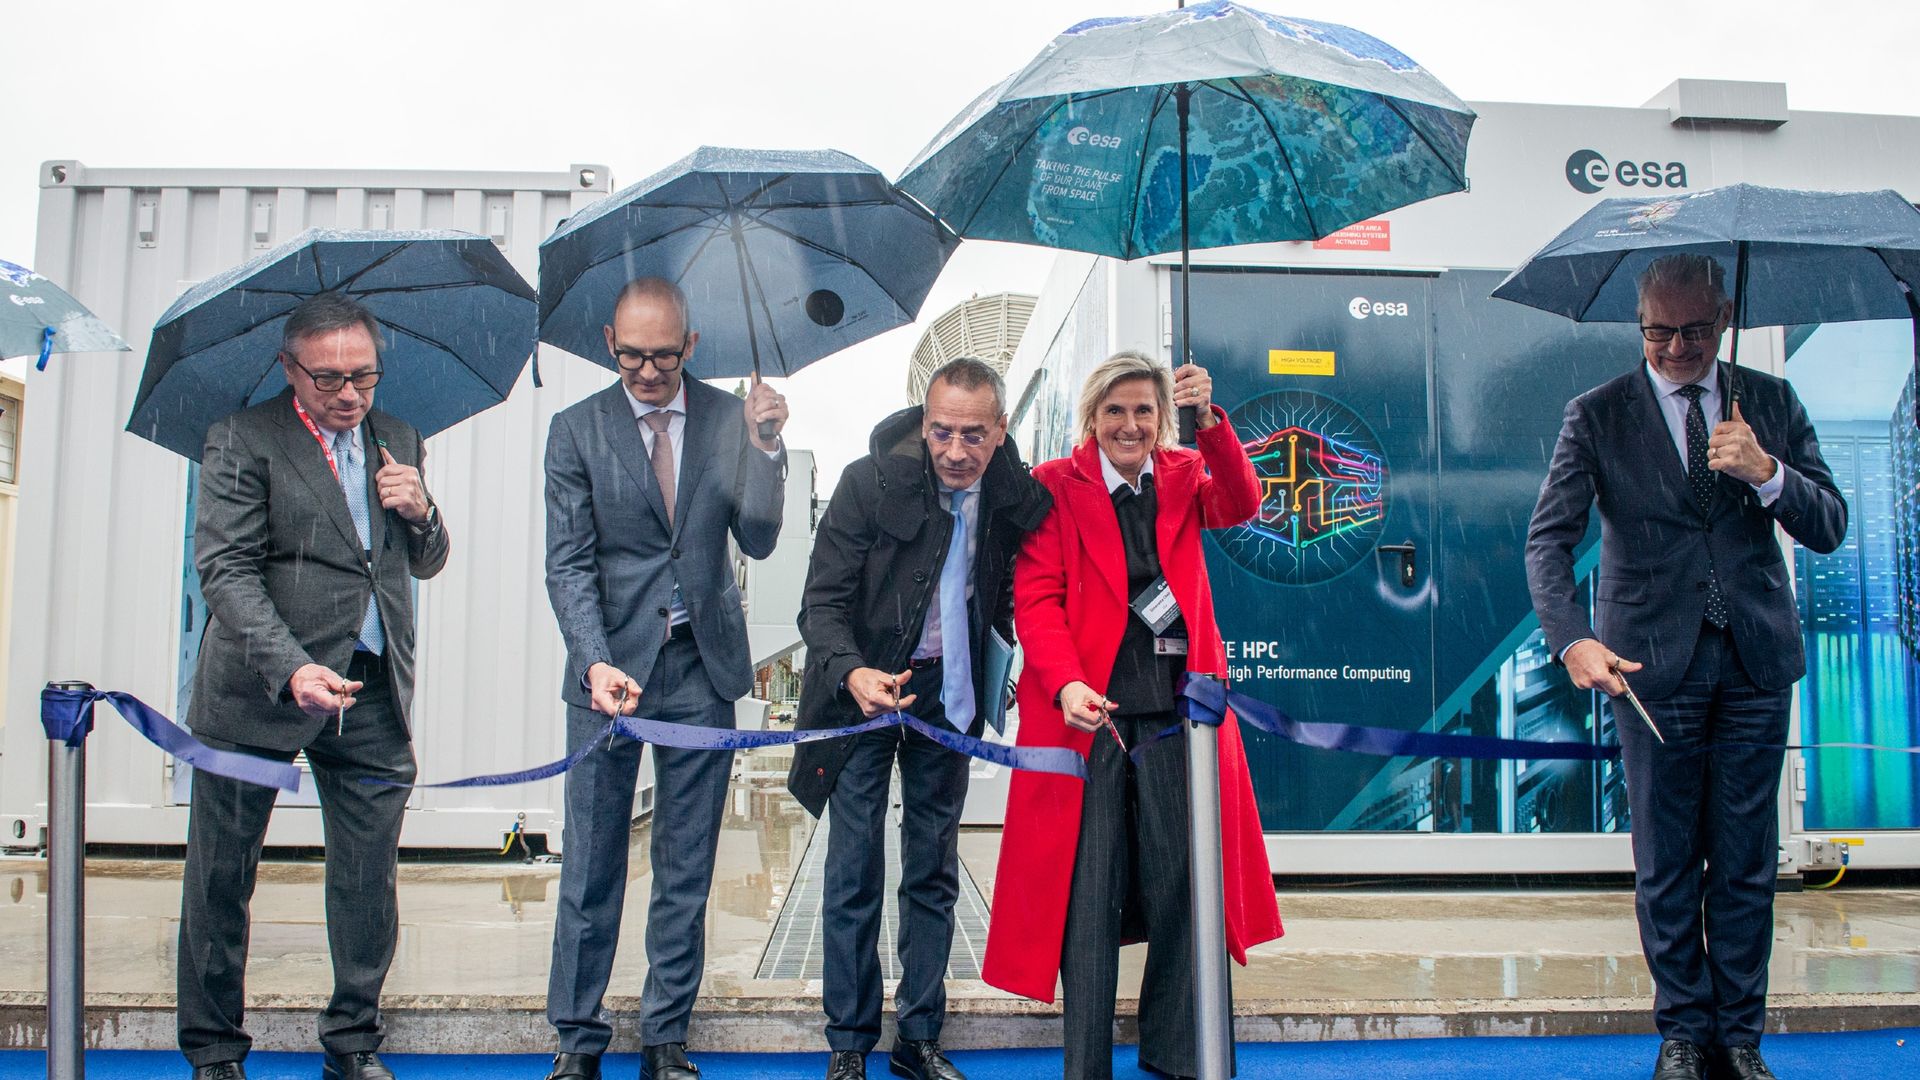
Chelli (center right) was one of the people chosen to cut the ribbon at the opening of ESRIN's Space HPC supercomputer on March 12, 2025. (Image credit: ESA)
So instruments like SpaceHPC, which have high computing capability, help us a lot to process those datasets faster.
HB: What is your favorite satellite photo of Earth?
SC: I have too many favorite satellite photos, I must say. But this summer, the one I really found striking was a thermal image of Europe's heatwaves because, in that image, you see that the temperature on land and on sea was increasing so much.
This photo, captured by ESA's Sentinel-3B satellite in June 2026, shows land and sea surface temperatures spiking across Southern Europe. While it is concerning, Cheli says that the image gives her hope about our ability to monitor such extreme weather events in the future. (Image credit: ESA/Sentinel-3B)
It was captured by Sentinel-3B [a predecessor of the recently launched Sentinel-3C], and you see the red in the sea, and you see the red on the land, and I think it gives the feeling of the heat wave that we've all been living through this summer. We had, I would say, the hottest summer ever.
But it makes me feel that we can do a lot about it. It makes me feel that we have tools and certainly information capabilities to support, help, and also raise awareness about this topic.
So right now that is a favorite, but there are so many [other photos].
This interview has been condensed and edited for clarity.
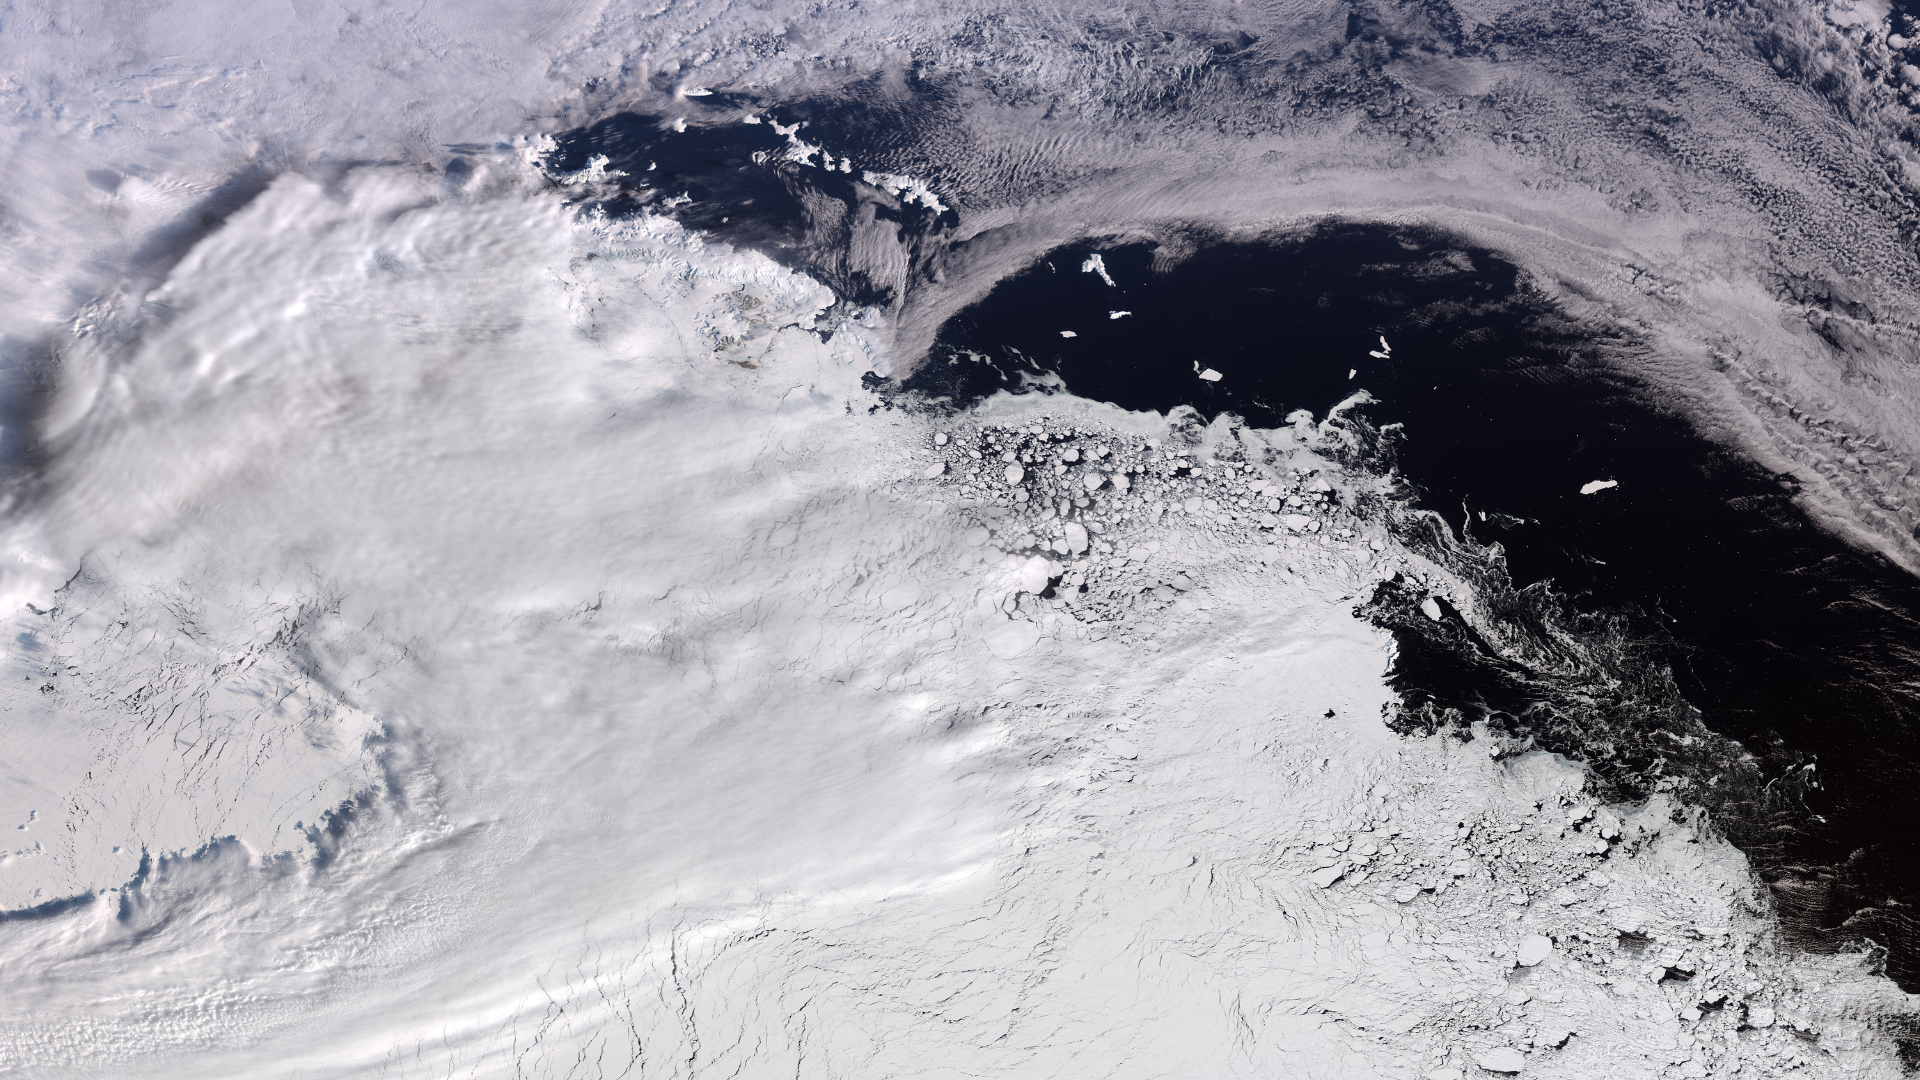
Ice floats by in West Antarctica as winter comes to an end in the Southern Hemisphere. (Image credit: contains modified Copernicus Sentinel data (2026), processed by ESA)
Antarctica is a magnificent sight, and that beauty is visible all the way from space.
What is it?
Orbiting planet Earth, the European Space Agency's (ESA) Copernicus Sentinel-3 mission captured a close-up of West Antarctica.
Winter is ending in the Southern Hemisphere, meaning this is the peak of icy weather and sea ice in the Arctic.
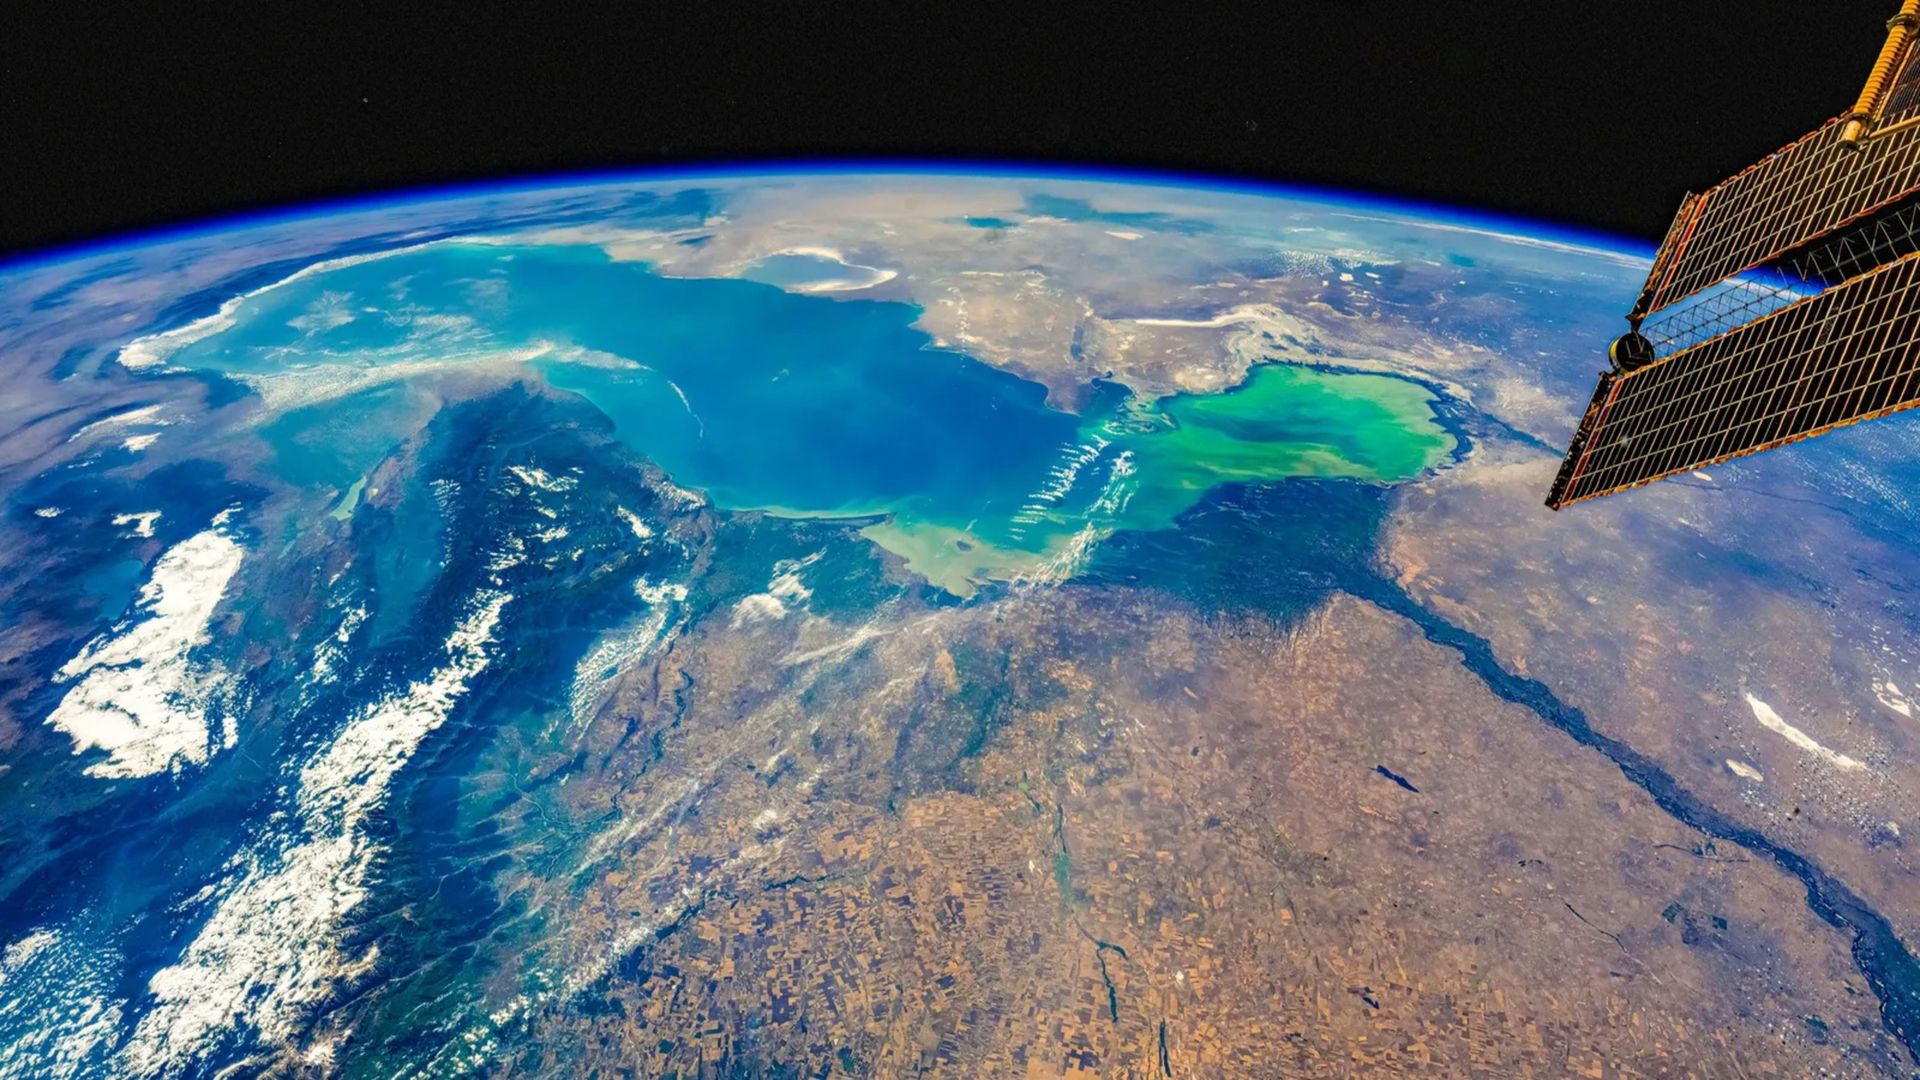
In this image snapped by Sentinel-3, you can see a massive swath of ice which includes Elephant Island on the left-hand side. An ice-covered island off the Antarctic coast, Elephant Island floats in the Southern Ocean. It got its name both from the island's shape, which some liken to that of an elephant's head, and the fact that the island is home to a community of elephant seals.
Why is it incredible?
While a seal-inhabited island on the left floats near the Antarctic coast, across the water is a vast, frozen landscape. In just this snapshot, you can see about between 746 and 1,056 miles (1,200 to 1,700 kilometers) of the icy continent.
This image was captured on Sept. 30, 2026. In the Southern Hemisphere, that was just past the end of winter. The absolute peak for sea ice in Antarctica fell just a couple weeks before, on Sept. 14, according to the National Snow and Ice Data Center, ESA reported.
So in this one snapshot, we can see a near-maximum for sea ice in the Antarctic, spanning hundreds of miles. In observing our own planet from space, we are able to peer across vast landscapes, capturing important observational data. This is especially critical for the Antarctic as, with the progression of climate change, this sea ice continues to dwindle, adding to sea level rise among other serious consequences across the planet.
Where did it start? How did it grow complex? Why did it get big? Three moments in Earth’s early history when evolution suddenly, inexplicably turned up the dial.
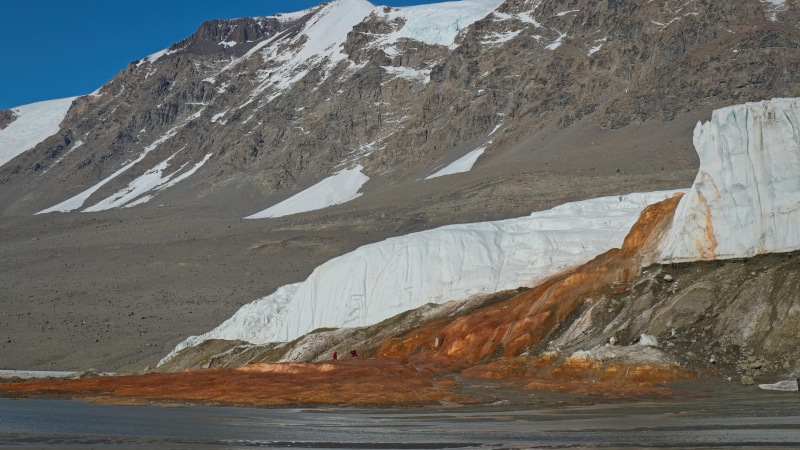
Blood Falls is a five-story waterfall that flows out of Taylor Glacier in Antarctica. The water comes from a salty lake beneath the glacier that’s rich in iron. When the water reaches the glacier’s surface, the iron interacts with oxygen in the air. This reaction turns the water red. It’s the same reaction that creates reddish rust on a nail.
Scientists suspect the lake was filled by ocean water 5 million years ago. But it’s been completely cut off from other water sources for at least a million years. Over time, the water became saltier as the glacier formed above. Now, the lake is more than twice as salty as the ocean. The water can’t freeze because salt prevents water molecules from locking into the crystal structure of ice.
Because the lake is also cut off from the atmosphere, scientists call it a biological time capsule. Microbes have lived here for millions of years with no light or oxygen. Instead, these extremophiles get their energy from molecules called sulfates. This respiration strategy is similar to microbes that live in deep-sea thermal vents.
But the Blood Falls microbes are special. They extract oxygen from the sulfates and leave behind other molecules. When these leftovers interact with iron in the water, they turn back into sulfates. This means these microbes have a practically unlimited energy source.
Scientists suspect planets like Mars and Jupiter’s icy moons could be home to salty underground lakes like this one. How these microbes make a living might be a clue for how life could work on other planets, too.
In a sentence
Blood Falls is located in East Antarctica, more than 3,300 kilometers (2,000 miles) south of New Zealand.
When millions of people died in Europe during the Black Death, biodiversity suffered too, new research suggests. The findings suggest that human activities once promoted biodiversity in the landscape — and experts say we could use these findings to boost biodiversity in our modern agricultural landscapes.
The 14th century was a tumultuous time for the people of Europe. Persistent cold, wet weather at the beginning of the century led to widespread agricultural failures and unprecedented levels of starvation in what became known as the Great Famine from 1315 to 1317.
This was followed by the Black Death, an epidemic of bubonic plague caused by the bacterium Yersinia pestis that killed more than a third of Europe's population. As a result of the widespread deaths and resultant social upheaval, large swaths of agricultural land were abandoned. Population levels didn't begin to recover until the 16th century.
The Black Death era is the perfect opportunity to look at the effects of humans on biodiversity over a longer period, Jonathan Gordon, a paleoecologist at the Leverhulme Centre for Anthropocene Biodiversity at the University of York and first author of the paper, told Live Science.
In the study, which was published March 4 in the journal Ecology Letters, the researchers compared more than 100 European pollen records that included about 4,600 samples. The records came from sites ranging from the lowlands of France and uplands of the southwest United Kingdom to the Swiss Alps.
The pollen records "give us information on the past diversity of the plant records," Gordon said.
For example, cereal grains — such as wheat, barley and rye — were a fundamental part of medieval agriculture. The representation of pollen from these types of crops in the pollen record points to historic land use.
The researchers divided the pollen data into three categories based on the presence of cereal pollen: places where agricultural production went up, places where it went down, and places where there was no evidence of cereal cultivation.
"We found a decline in biodiversity overall, but the decline overall was driven by those landscapes that declined in agricultural production," Gordon said.
"In those landscapes where agricultural production went down, there was a reduction in biodiversity of around 40%. Then, after about 150 years, as populations started recovering and landscape disturbances started increasing again, biodiversity went up to slightly above the level it was before."
Mosaic landscapes
Many people think there was a "stable and pristine world in which the entry of people has only one result: net loss of species and homogenization," Erle Ellis, an agroecologist at the University of Maryland, Baltimore County who was not involved in the research, told Live Science in an email. "The paleoecologists have always known the story is far more complicated."
There is a growing body of evidence showing that people's long-term cultural shaping of their landscapes often creates more diverse habitats, known as "mosaics," that can sustain more species than simple homogenous landscapes can, he said.
Whereas modern agriculture focuses on single crops on plots of land, in previous centuries, "you had all these different types of agriculture operating within the same landscape," Gordon said.
"In that landscape, you had lots of natural features that remained from the Middle or Early Holocene (which began after the last Ice Age about 12,000 years ago)," he added. "You had old bits of woodland, you had heaths, you had ponds, and bits of secondary forest. It was all interlaced with these agricultural mosaics, and that led to raised biodiversity because there were more habitats for different plant species to exploit."
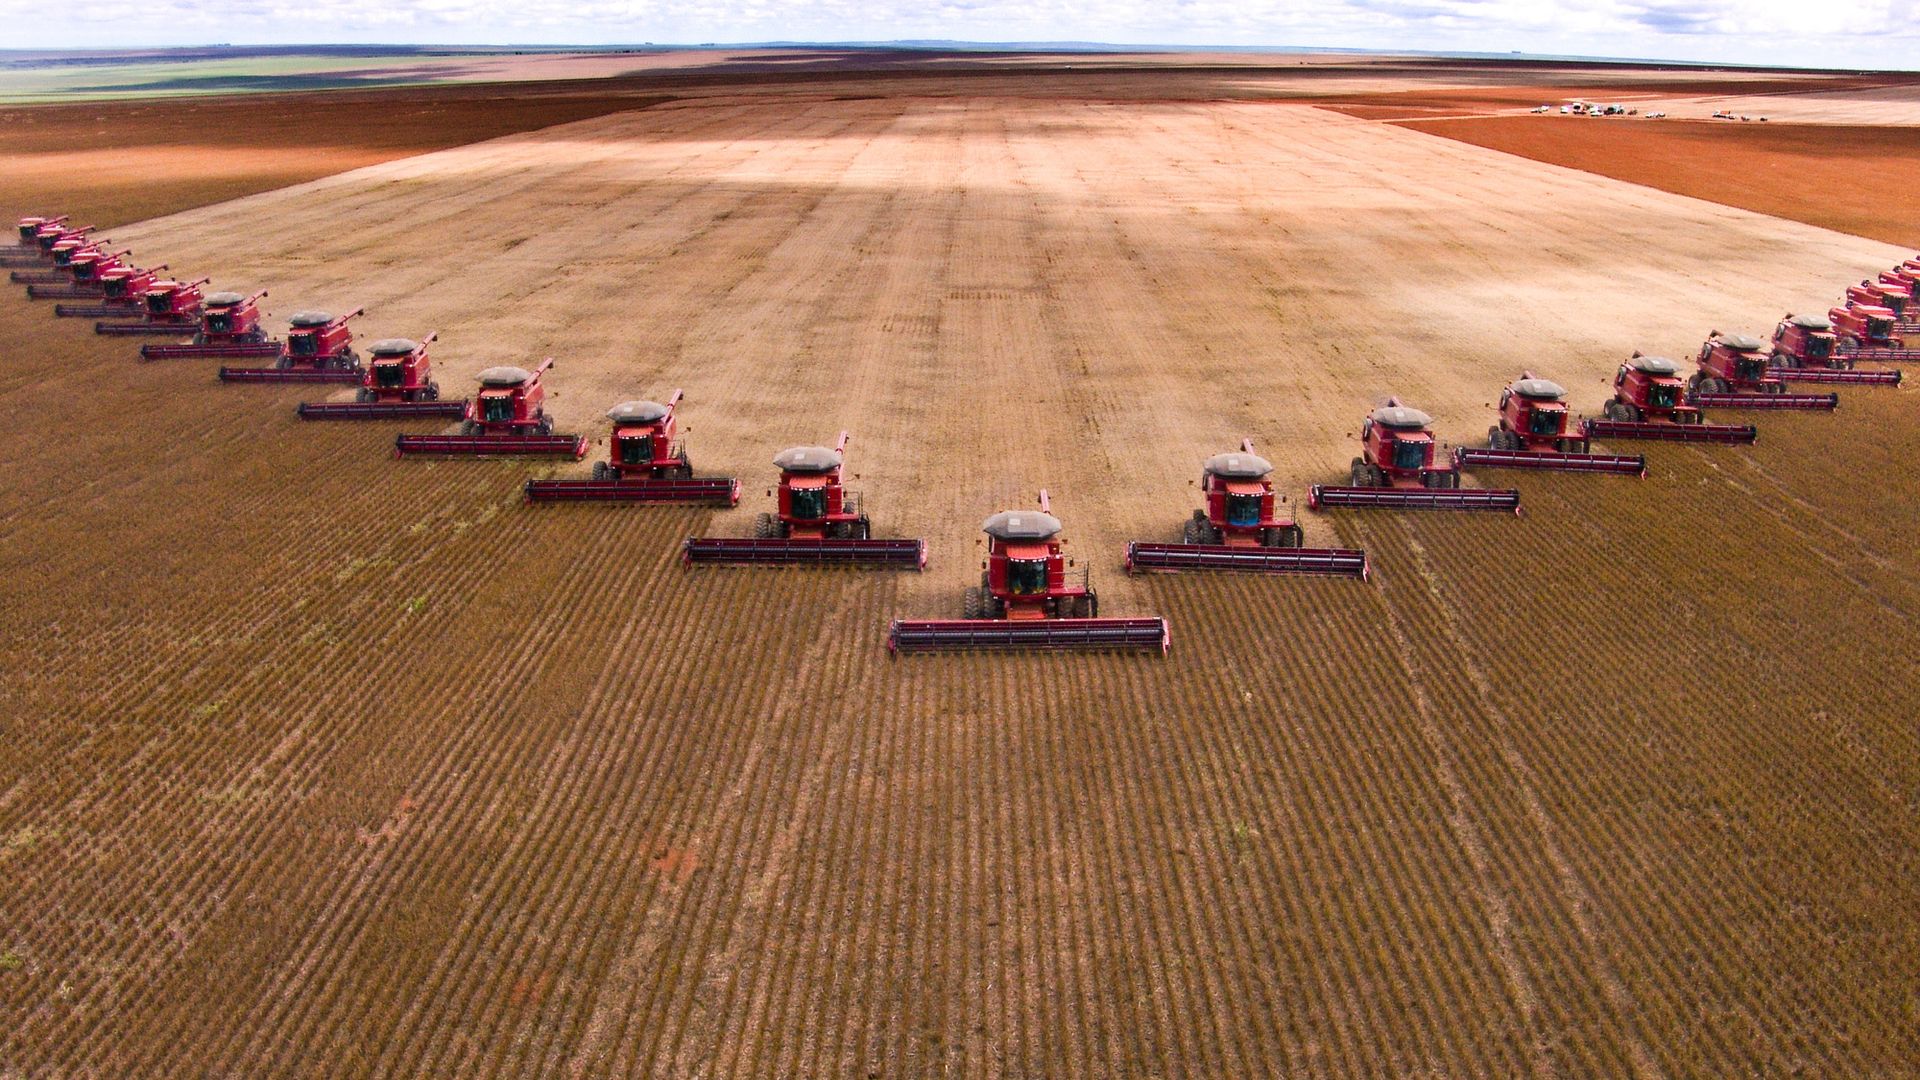
Modern farming often uses monoculture, where one crop species is grown over a large area. This lowers biodiversity in the area. (Image credit: alffoto via Getty Images)
The findings highlight the differences between medieval and modern land use practices — and their consequences for biodiversity. Research suggests that during the 20th century, global biodiversity declined by up to as much as 11% and human activities, such as land-use changes, pollution, and climate change, are the major culprits. In agriculture, the practice of monoculture — where a single crop species is grown over a large area — reduces biodiversity.
"What this work contributes to showing is that, until relatively recently, even in Europe, very different forms of land management and interaction were practiced than exist today," Patrick Roberts, director of Department of Coevolution of Land Use and Urbanisation at the Max Planck Institute of Geoanthropology, told Live Science in an email.
"Rather than the monoculture, plantations, or uniform changes to landscapes we see in the 20th and 21st centuries, emphasis was placed on maintaining 'mosaics,'" said Roberts, who was not involved in the new research.
In the study, "we can see how relationships between people and biodiversity have changed through time and how people can actively use landscapes while maintaining biodiversity and mixed ecosystem functions," he said.
There is still more to understand about how humans' disappearance from landscapes in the Black Death era affected the natural world, Gordon said. "There are a lot of other types of diversity — not just the number of types, but what the different types present actually do." There may be a hundred types of plants in a landscape, but if they do the same thing, "you have low functional diversity," he said.
Functional diversity "is super important for how ecosystems adapt to changes in climate and how resilient they are, which is something we need for future-proofing our agricultural system," Gordon said.
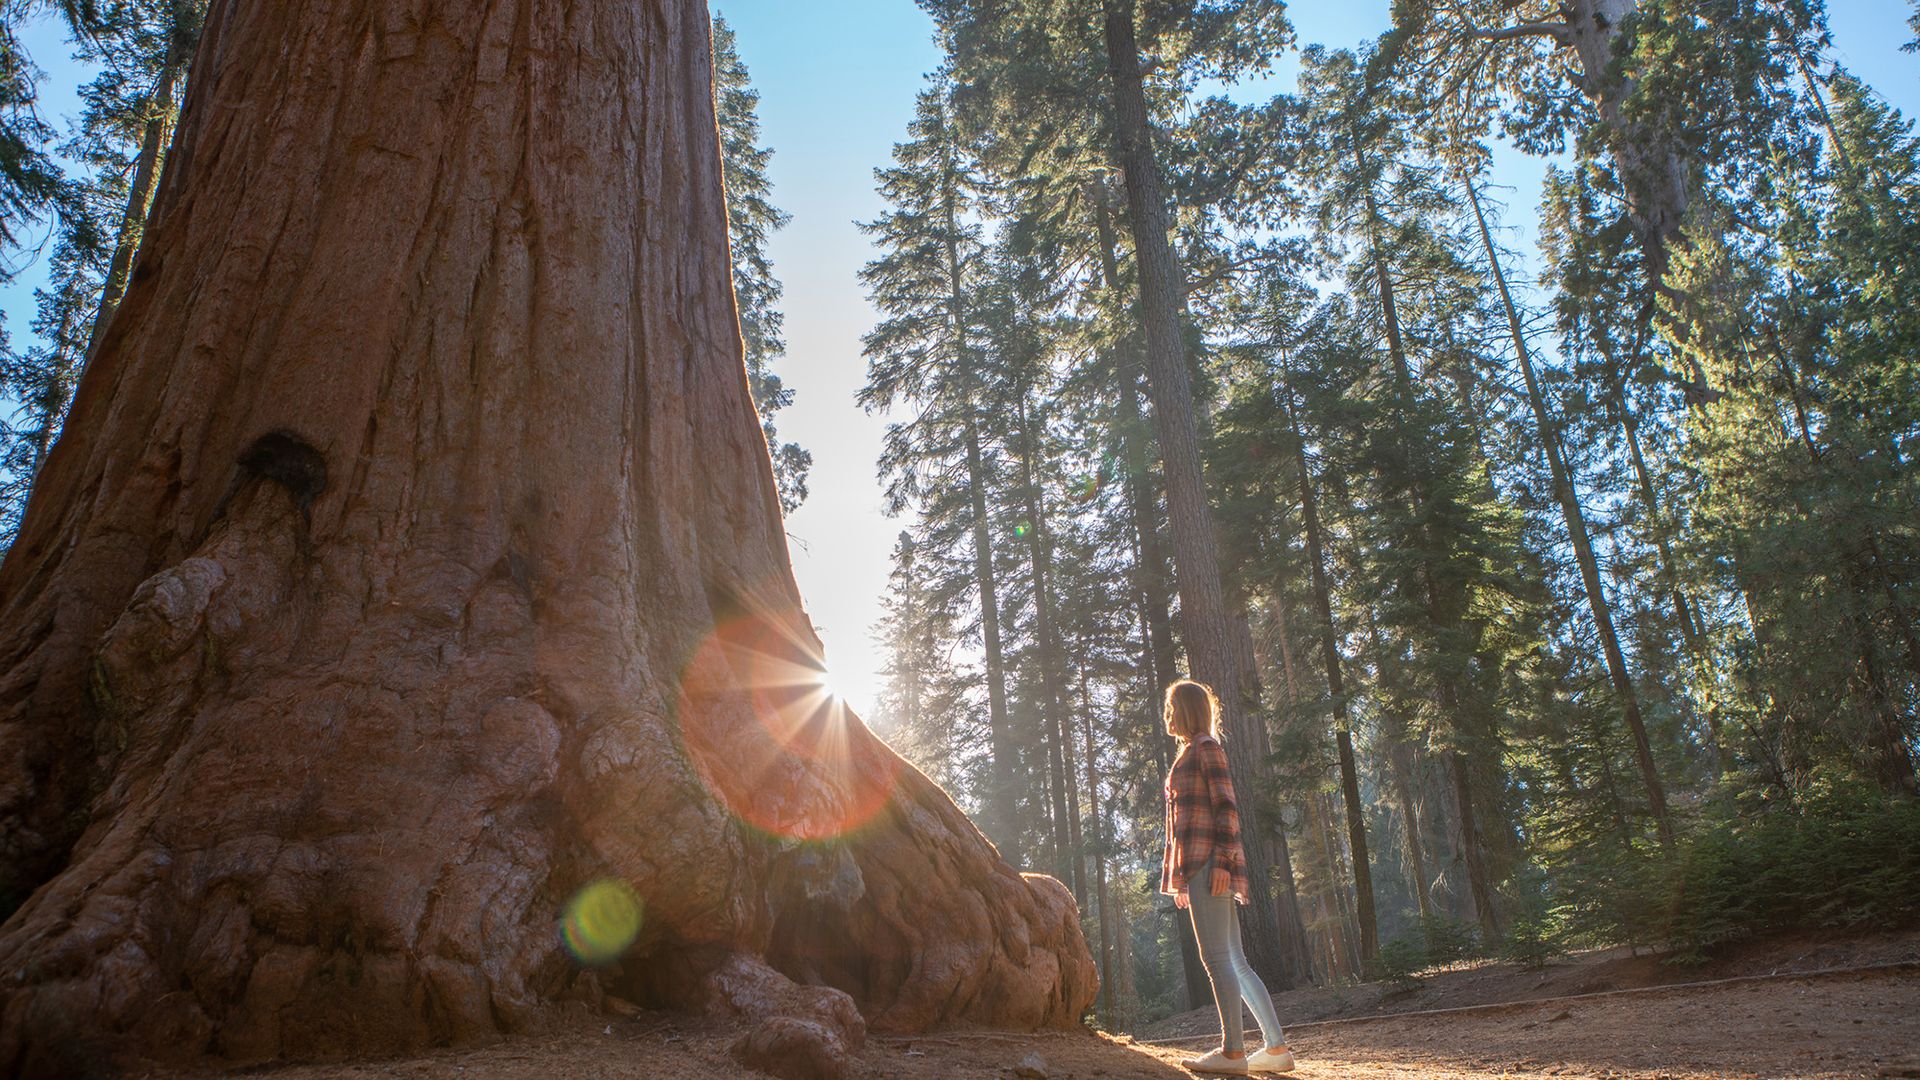
When temperatures spike, California redwoods slow down photosynthesis, new research has found. This finding has serious implications for the long-term survival of the iconic trees in a warming world, and their role in storing carbon from the atmosphere.
The region has seen significant warming in recent decades, and faces more frequent extreme heat days, with temperatures spiking above 100 degrees Fahrenheit (37 degrees Celsius). Now, in a new study, published Sept. 22 in the journal JGR Biogeosciences, a team of researchers has shown that California's renowned redwoods are struggling to photosynthesize in the heat.
Photosynthesis is the process used by plants, algae and some bacteria to turn sunlight into energy. It chemically converts carbon dioxide and water into sugars and oxygen.
"These trees adapted to grow in really temperate environments, so no one had really looked at the impact of heat on photosynthesis," study first author Lily Klinek, a doctoral candidate in the Plant Optics Lab at the University of California, Davis, told Live Science.
From 2022 to 2024, Klinek and colleagues measured how the leaves of redwoods in Garcia River Forest in Mendocino County responded to the heat. Once or twice a month, the researchers took three different California redwood leaf samples and measured their fluorescence and temperature.
The researchers wrapped a fourth leaf in tinfoil for 20 minutes to put it in a state of "rest" before taking the same measurements. "When they're in a state of rest, we expose them to a pulse of light that’s in the wavelength they would use for photosynthesis to see what would be their maximum photosynthetic rate," Klinek said.
They found that on hot days, the leaves exposed to sunlight were up to 18 degrees Fahrenheit (10 degrees Celsius) hotter than the air temperature. "That's a huge difference and indicates that the leaves are stressed to the point where they can't thermoregulate effectively," Klinek said.
Many plants' leaves manage their temperature and photosynthesis by opening or closing their stomata, which are tiny pores on their surface. These stomata (from the Greek word for mouth) regulate the amount of carbon dioxide entering the plant, and how much oxygen and water vapor it releases. Lower carbon dioxide intake leads to reduced photosynthesis, meaning the plant has less energy.
The large differences between air and redwood leaf temperatures suggest that the leaves had closed their stomata to avoid losing water from evaporation during hot conditions and consequently overheated, Klinek said.
To further investigate the impact of heat on leaf physiology, the researchers took California redwood leaf samples back to the laboratory and exposed them to a range of temperatures while they were in water. Despite their access to water, the leaves still photosynthesized less as they got hotter, even though their stomata were open, Klinek said.
This shows that heat imposes direct limitations on redwood photosynthetical capacity, rather than indirectly decreasing that capacity by causing stomatal closure, the researchers wrote. The finding indicates that redwoods' ability to photosynthesise and store carbon will decrease as temperatures rise.
"It is not only stomatal closure that is causing reduced photosynthesis," Lucy Rowland, an ecologist at the University of Exeter in the U.K. who was not involved in the study, told Live Science in an email. "These trees are already suffering from the direct effects of heat on their photosynthetic systems."
The finding has serious implications for the future of redwoods and similar plants. "The points at which this damage becomes irreversible remains really poorly understood, but is something which is really essential to understand if we want to predict how our future climate is going to impact plants," she said.
The next step in Klinek's research is to move beyond leaf physiology to understand these thresholds on the trees and their ecosystems as a whole.
"We're not sure to what extent the effect that we saw is a reversible stress response and if they are sustaining damage from this constant stress," she said. Researchers need more data to "really get a better sense, beyond the leaf scale, how these ecosystems are responding to heat and drought," she added.
Sometimes, it takes a great struggle to build towering peaks. And what more thunderous event is there than the clashing of continental plates?
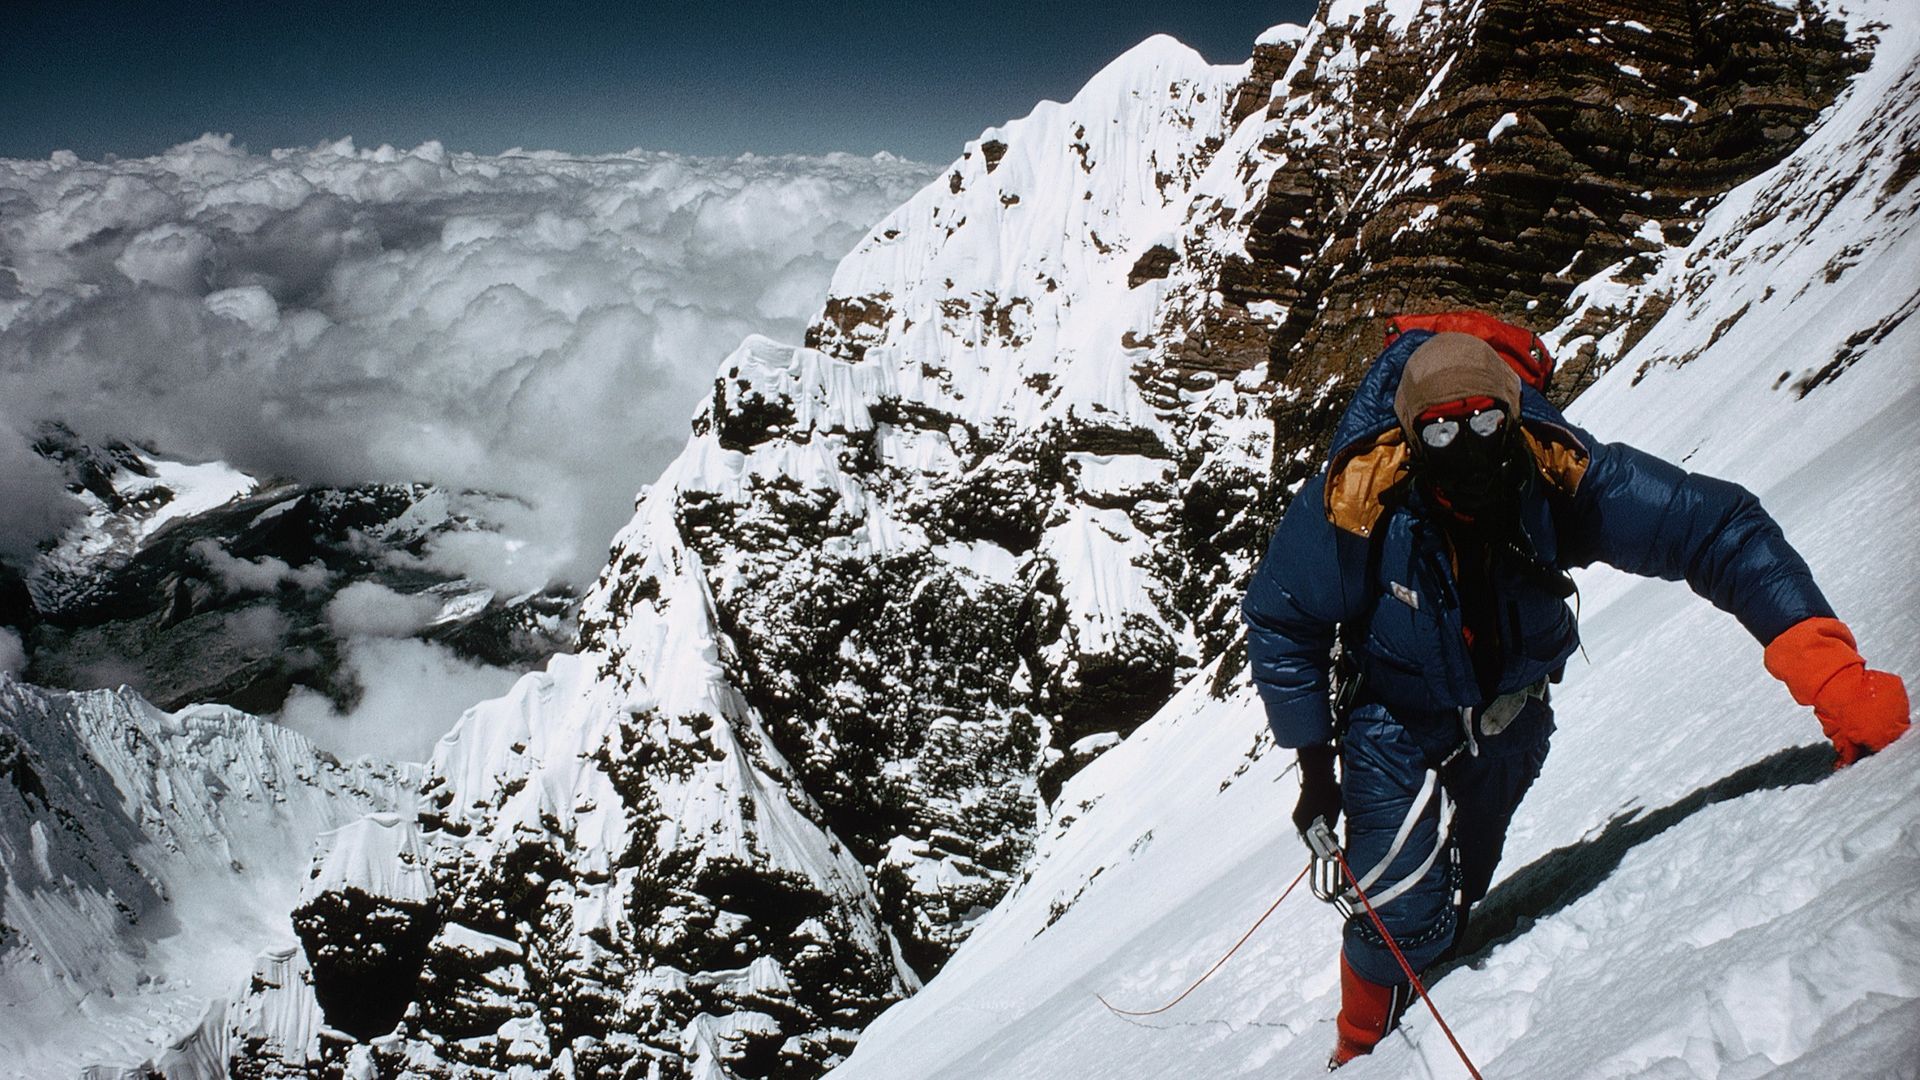
Geological pileups have birthed some of the largest and tallest mountains on the planet, including Mount Everest and its Himalayan neighbors. But has there ever been a peak taller than Mount Everest, which stands 29,032 feet (8,849 meters) above sea level?
The answer is still a mystery, but there are some geological clues about where the tallest peaks would have been in the ancient past, experts told Live Science.
Earth's lost mountains
Geologists don't have the level of detail required to pinpoint an exact highest peak hundreds of millions of years ago. "We're never going to get that granularity, unfortunately," Alan Collins, a professor of geology at Adelaide University in Australia, told Live Science.
However, clues in residual sediments lodged inside Earth's crust hint at the lost grandeur of primordial snowcaps and summits. Scientists study these crusts to understand how deep they went, which can reveal how tall ancient mountains might have been.
Mountains are really just parts of the continental crust that have been thrust upward as tectonic plates slowly crash together. This crust is very heavy, and there is much more to it than what you see on the surface; even the most spectacularly tall peaks, like Everest, are anchored in deep crust. Just as crust gets thrust up to form mountain peaks, it also gets pushed deep under the surface. Both Collins and Ziyi Zhu, a geochemist at Curtin University in Australia, compared mountains to icebergs, in the sense that only a bit pokes above the surface.
"We can argue or speculate that [the biggest mountain] was in a place where there were deep roots in the crust," Zhu told Live Science.
Geologists estimate that the Himalayas, for example, have a crustal column that goes down as far as 50 miles (80 kilometers). Compare that to Everest's elevation of about 29,000 feet (9,000 m), and the world's tallest mountain at most represents only 14% of the rock slab it's part of. That means there's a limit to how tall mountains can get before they collapse under their own weight.
The Himalayas began forming between 50 million and 40 million years ago from the collision between the Indian Eurasian continental plates. As far as mountains go, they are relatively young. And that's partly why they are still so tall. Tall, jagged mountains erode quickly over time, though the Himalayas are still growing as the two plates continue to collide.
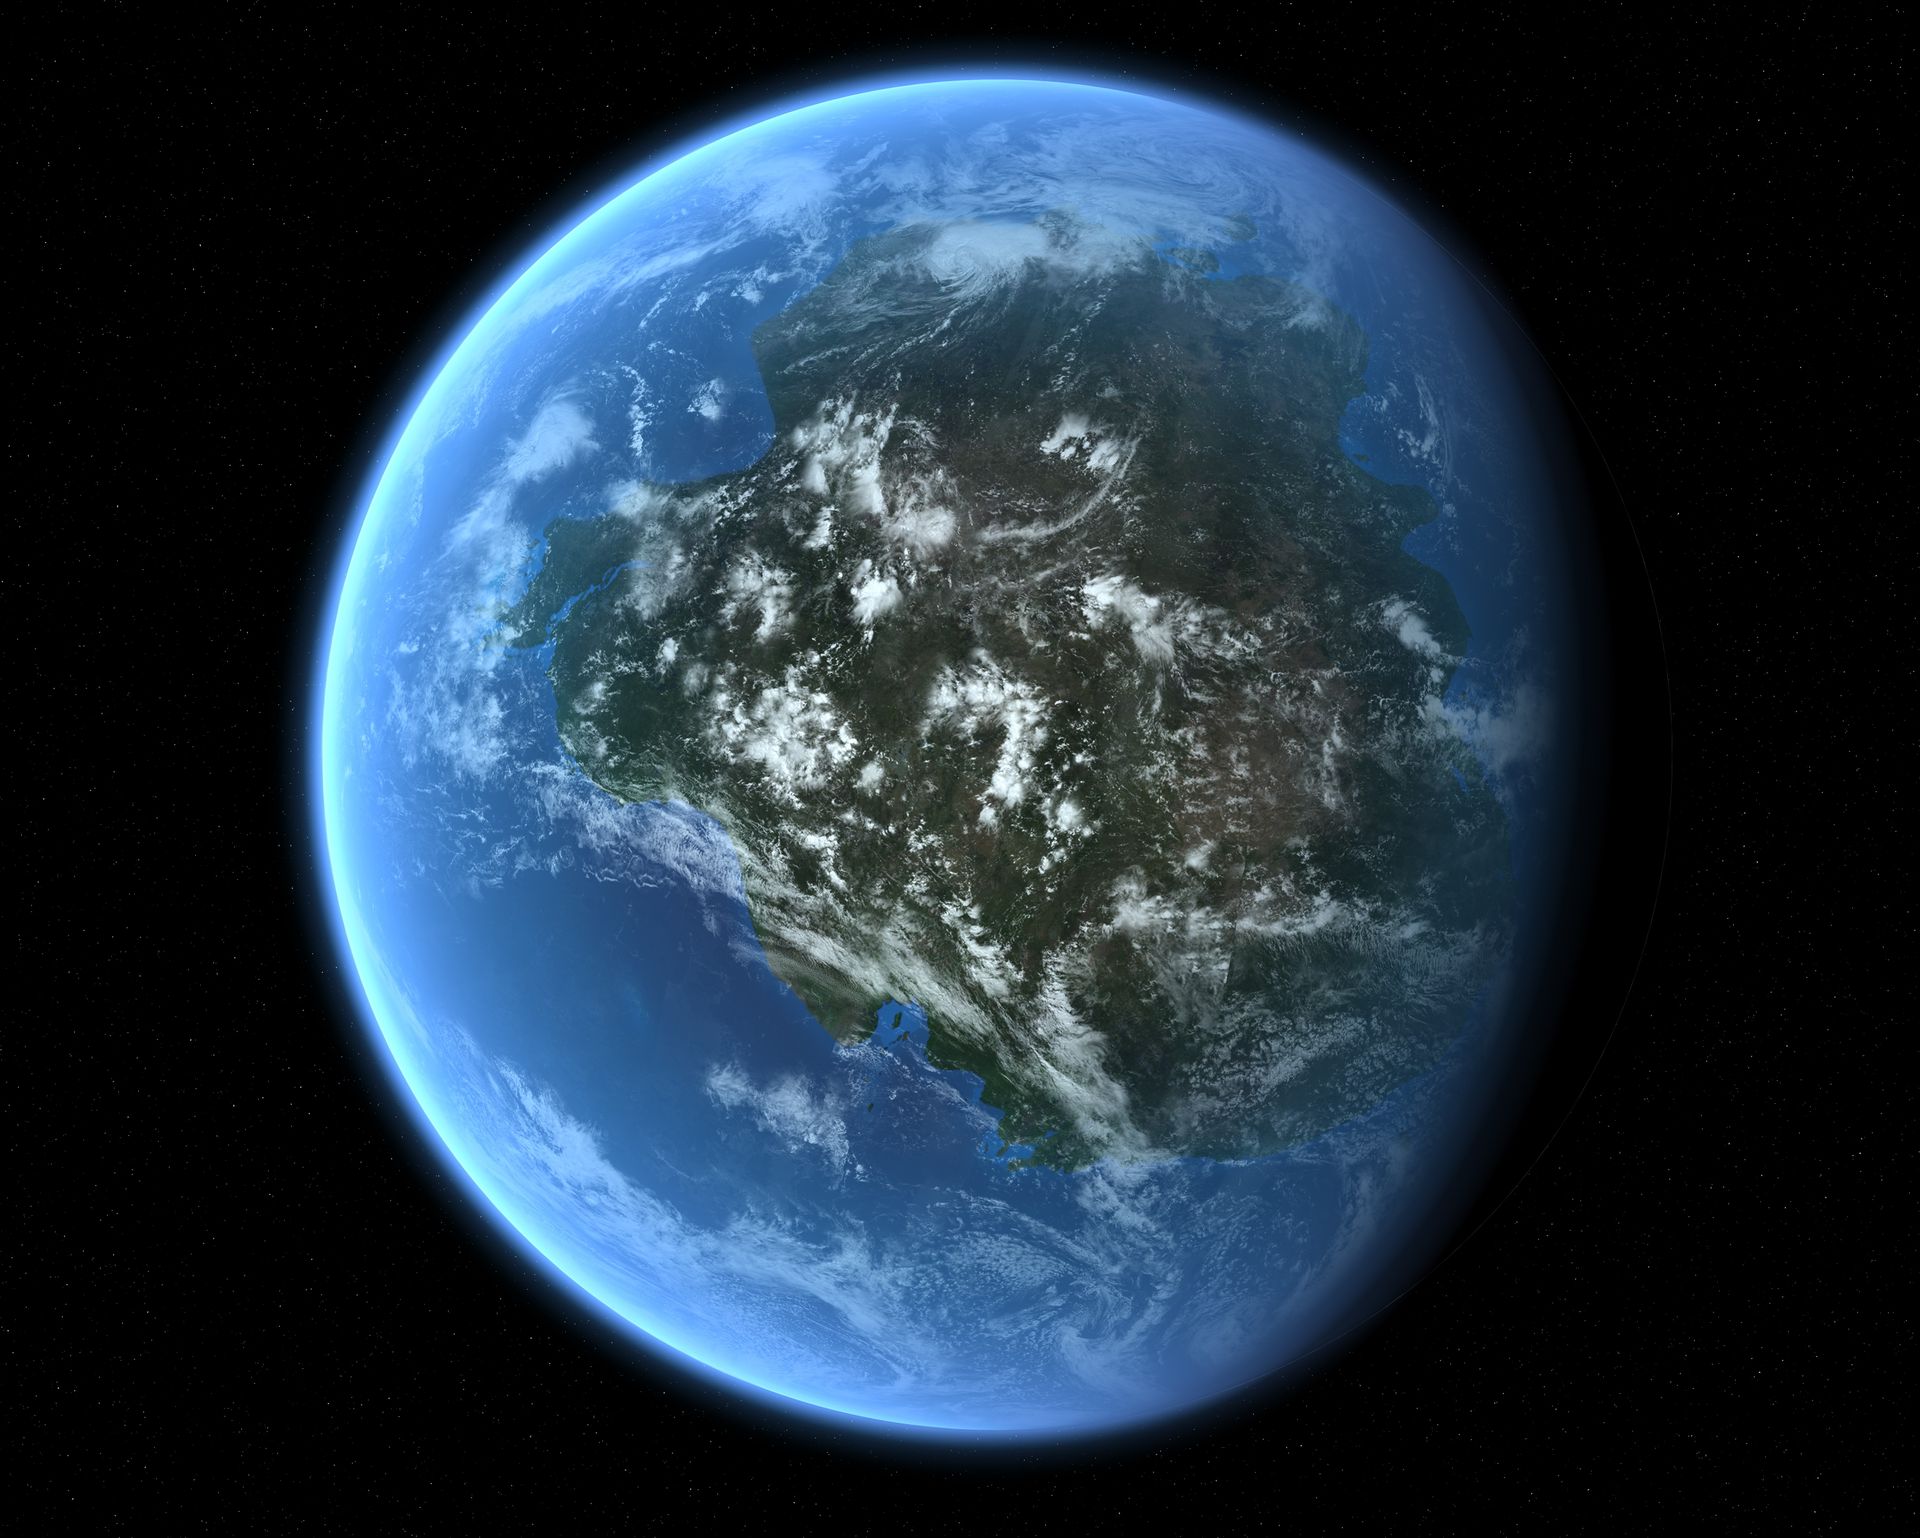
Such continental collisions have happened countless times before, though. For example, the Transgondwanan Supermountain, an ancient range in what is now East Africa, began emerging some 650 million years ago when Africa and South America crashed into Arabia, India, Australia and Antarctica to form the supercontinent Gondwana.
The ancient supercontinent of Gondwana. (Image credit: Mark Garlick/Science Photo Library/Getty Images)
Gondwana split up again, but evidence of these mountains in places like southern India, Sri Lanka, Tanzania and Kenya point to them being three times the length of the Himalayas. "If you walk around there now, you can see rocks that were at the bottom of this mountain belt," Collins told Live Science. On average, the crust is deeper than the crust of the Himalayas. "We think this is at least the scale of the Himalayas if not more," Collins said.
The crusts found in these areas also hint at how tall the mountains were, with sections that descend up to 18 miles (30 km) deep, despite half a billion years of erosion. "At some point, they were likely halfway down a crustal column that was 60 kilometers [37 miles deep]," Collins said. This means that the mountains above this base could have been as tall as Everest.
In the Himalayas, the tallest mountains sit around the rim of the Tibetan Plateau, which has the highest elevation on the planet, at about 3.7 miles (6 km) above sea level, on average. The Transgondwanan range may have had a similar plateau around southern Madagascar, meaning its rim would have been in eastern Madagascar, southern India and eastern Antarctica, Collins said.
Another candidate for the tallest mountains was the Grenville orogeny, which popped up with the formation of the supercontinent Rodinia starting about 1.3 billion years ago. Its remains can be seen around southeastern Ontario and northwestern Vermont. But less is known about this extinct range, Collins said, with some scholars arguing that it wouldn't have been as tall as the Transgondwanan range or the Himalayas.
Further back, some 2 billion years ago, the formation of the supercontinent Nuna (also called Columbia) also left evidence of truly giant mountains. Zhu's paper found evidence of this supermountain by examining the composition of zircon crystals left in the crust underneath this vanished range.
Look any further back, however, and the picture gets murkier. When Earth was hotter, mountains likely couldn't get as high because warmer crusts can support less weight, Collins said. Stable continental plates and rocks didn't start to form until about 4 billion years ago, and it took hundreds of millions of additional years for large continents to form.
For Zhu, the Nuna, Transgondwana and Himalaya ranges are currently the best candidates for holding the tallest mountains that ever existed. But it's likely impossible to pinpoint the highest specific peak, at least with current scientific methods. "It's an open question," Zhu said.
How much do you know about our blue planet? Test your terran knowledge with our Earth quiz!
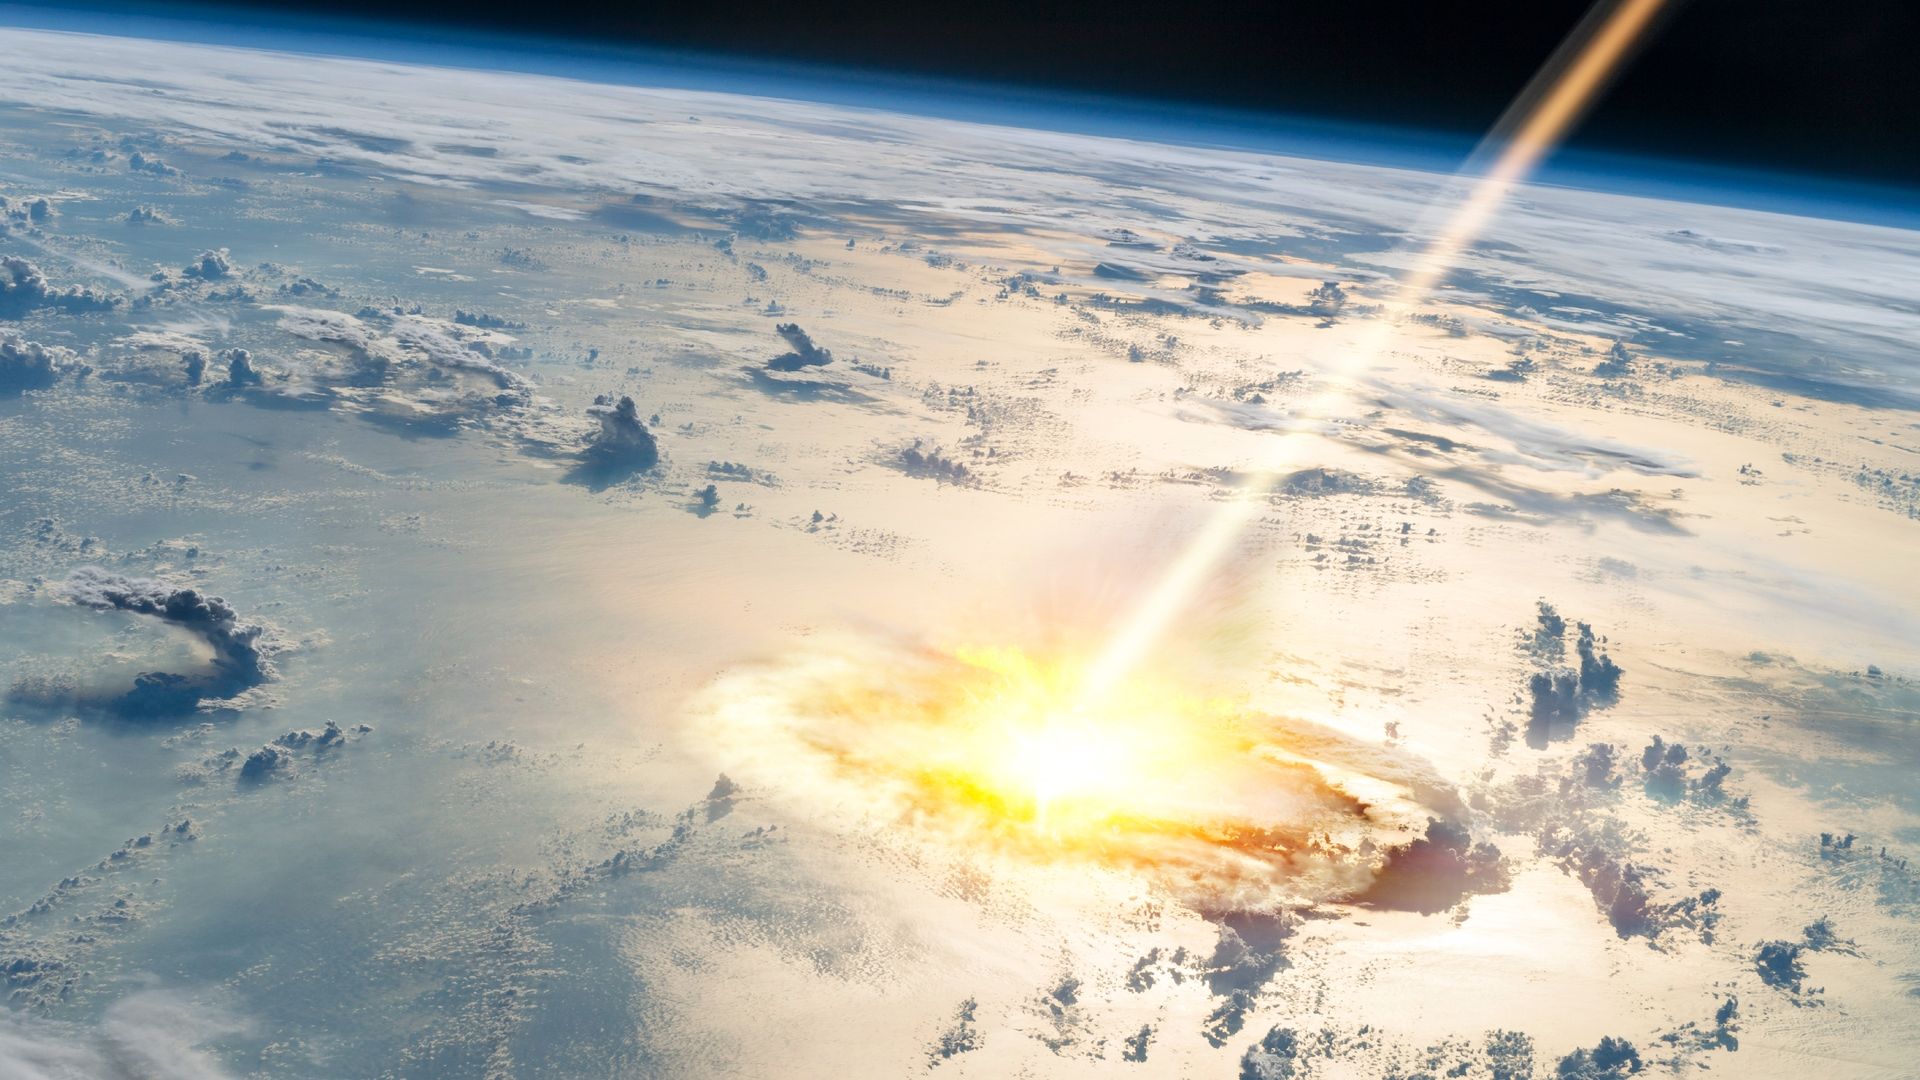
One of America's largest meteor craters is around 100 million years younger than scientists thought, which means the ancient impact coincided with — and potentially contributed to — one of the biggest global extinction events in Earth's history, according to a new study.
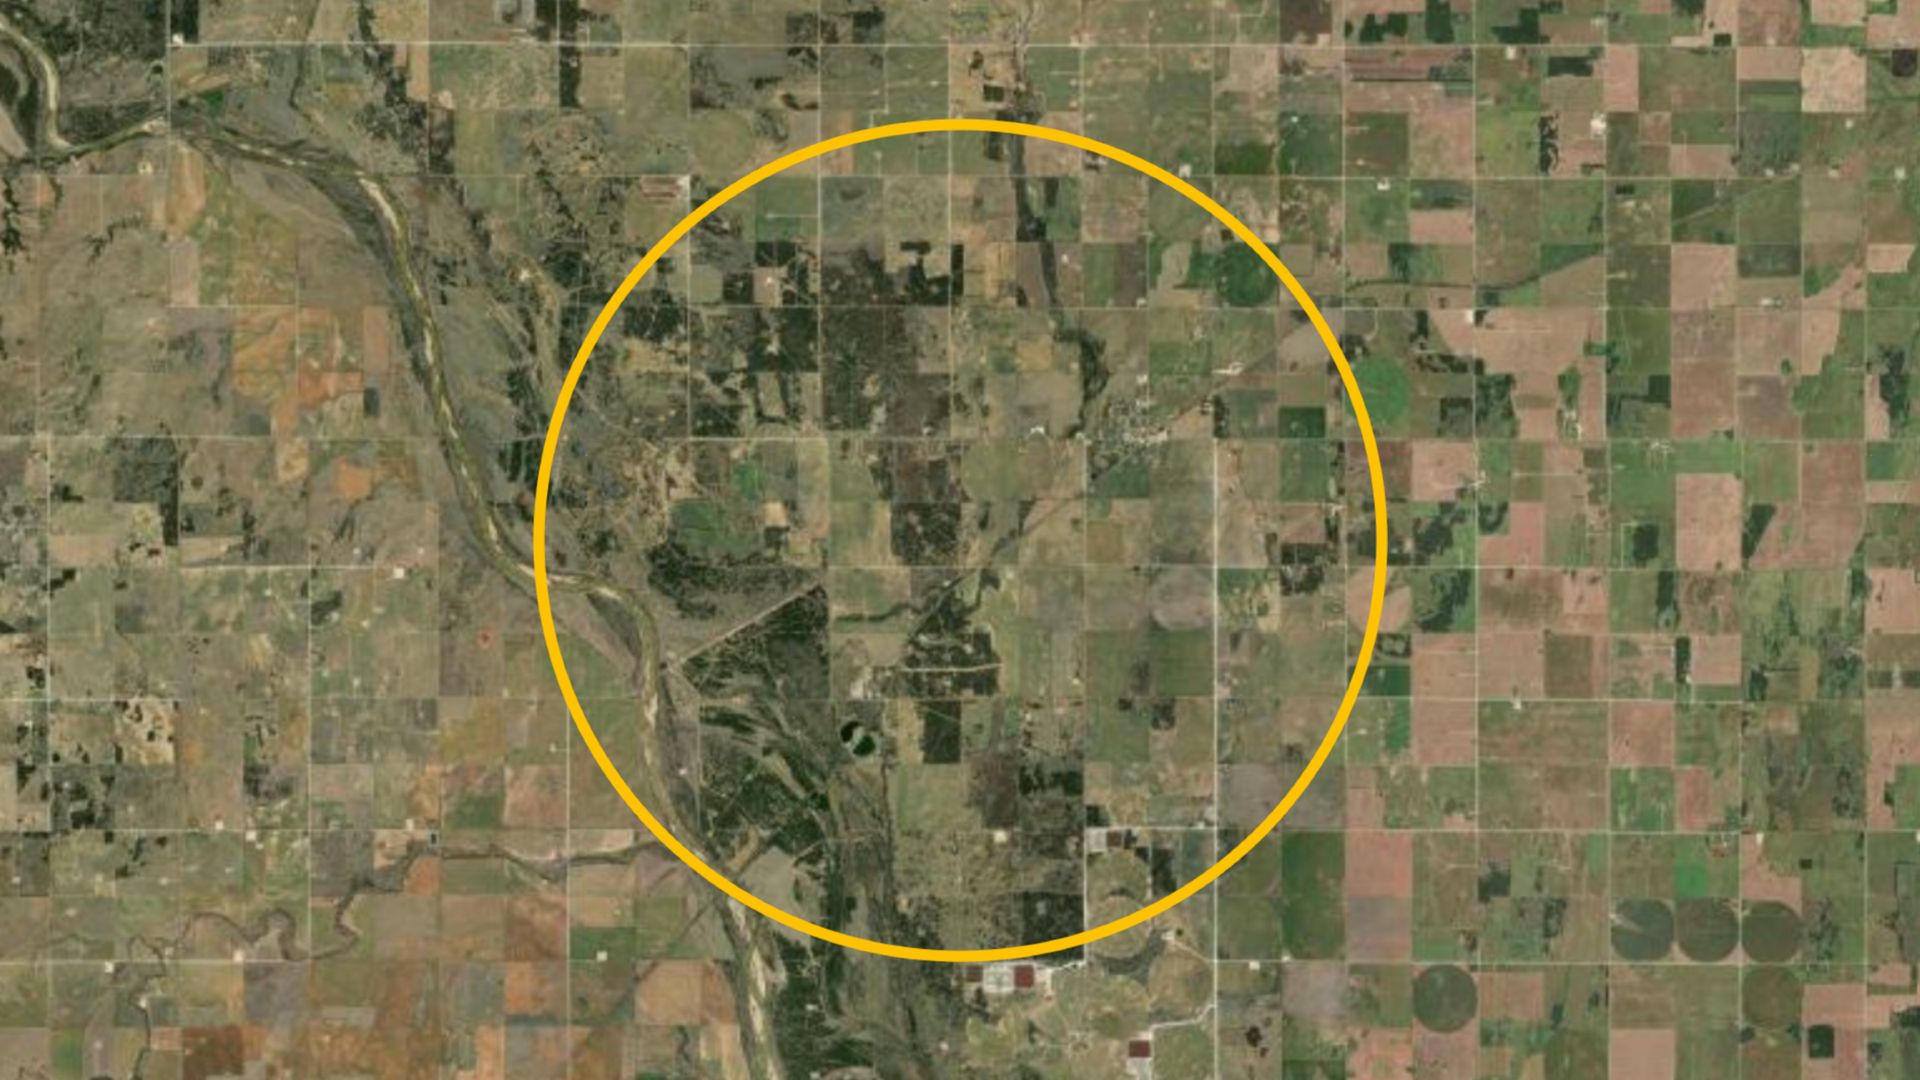
The underground impact structure, known as Ames crater, is located in northern Oklahoma and is named after a small town that sits above the submerged crater. At around 10 miles (16 kilometers) wide, it is the fourth-largest impact structure in the U.S.
Ames crater was created when an Eiffel Tower-size space rock slammed into our planet at more than 70,000 mph (110,000 km/h). At the time, the region was covered in a shallow ocean, and the crater was subsequently buried beneath layers of seafloor sediment. Therefore, there are no visible signs of the crater at the surface today. It was only discovered in 1991, when oil prospectors accidentally drilled into it.
Until now, researchers thought Ames crater dated to the Ordovician meteor event around 467 million years ago. During this period, an unusually high number of large space rocks smashed into Earth, likely due to the fragmentation of a single parent body somewhere in space. Scientists found fossils of marine animals in and around the crater that date to around the time of that event.
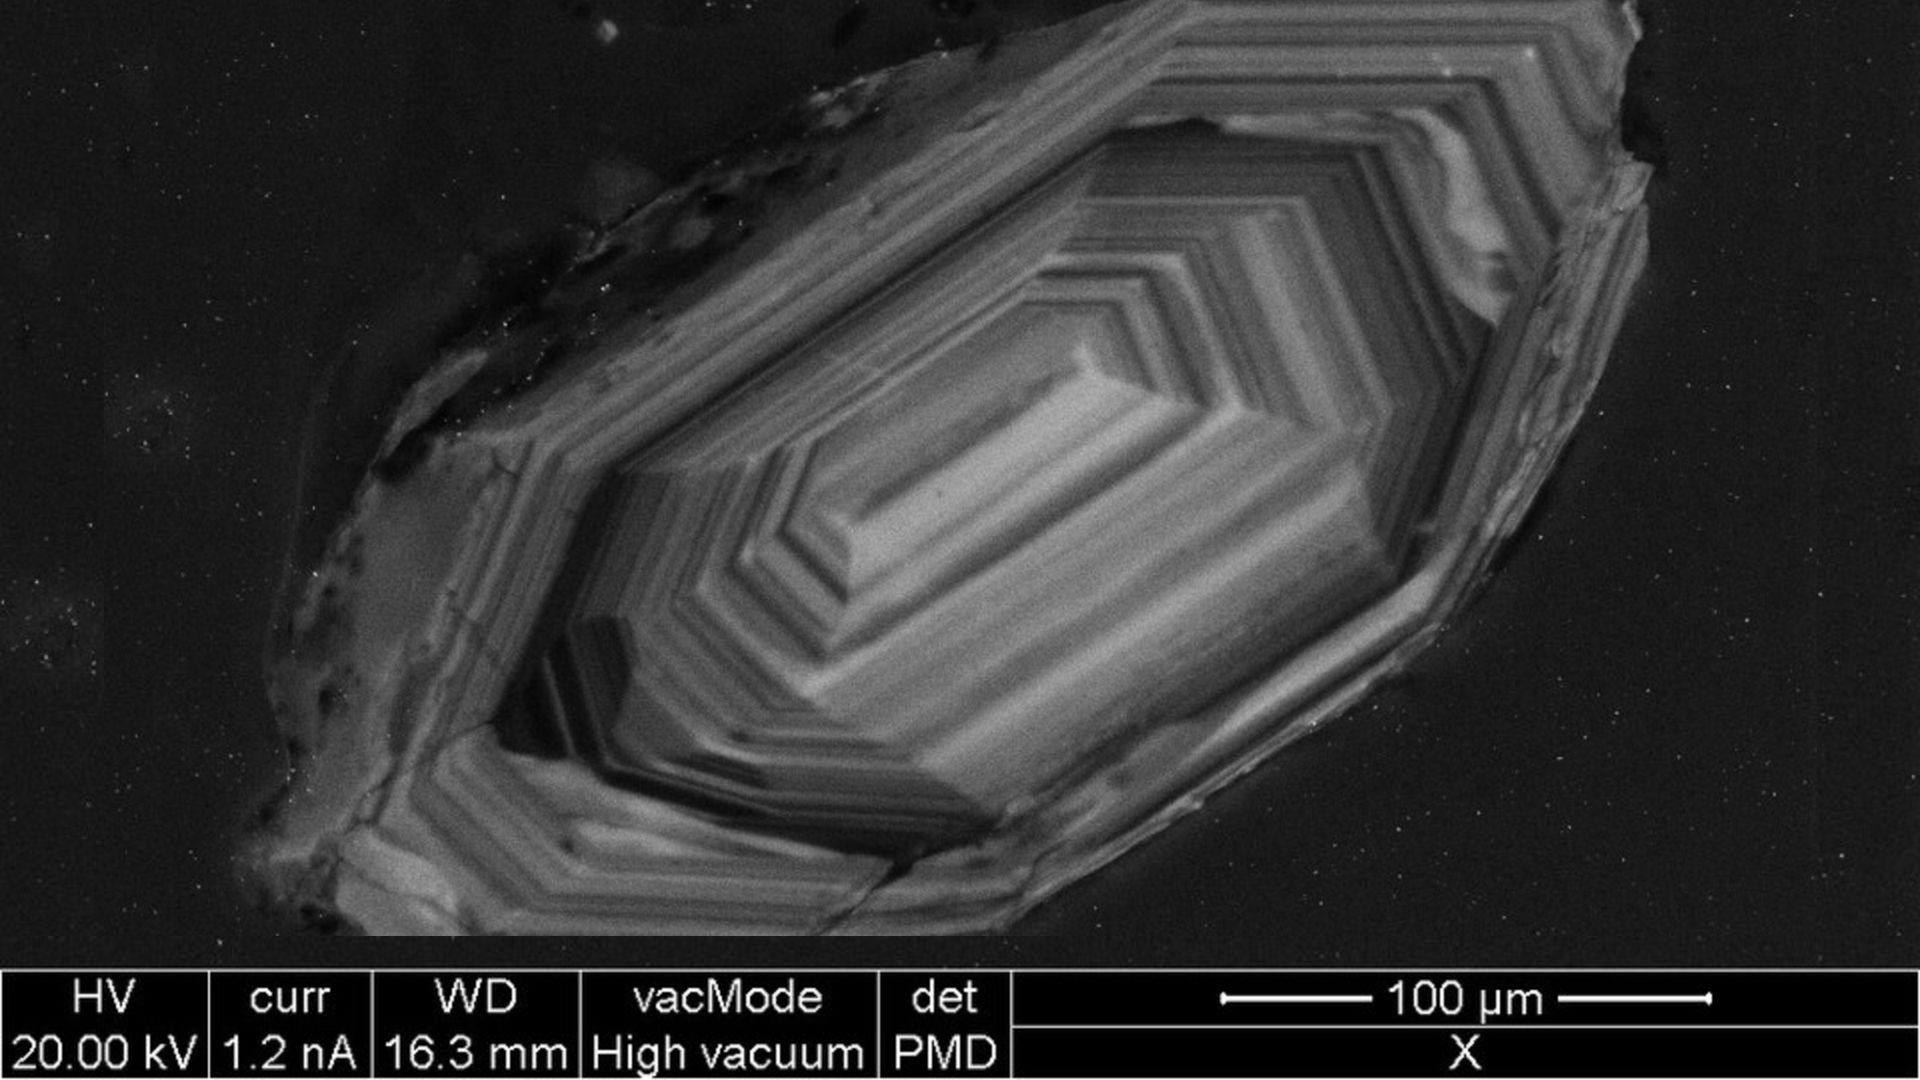
But in the new study, published July 7 in the journal Meteoritics and Planetary Science, researchers analyzed fracture patterns within tiny rocky fragments known as zircon crystals that were embedded in the underground crater. This revealed that the impact actually occurred 370 million years ago, around 97 million years after the Ordovician meteor event.
There are no visible signs of the Ames crater today. However, scientists have been able to map out its size and shape using ground-penetrating radar. This circle represents the rough outline of the the submerged structure. (Image credit: EarthExplorer/USGS/Landsat with annotations Harry Baker)
"No matter what technique we used, it was coming back to this younger signal," study first author Elizabeth Catlos, a geologist and planetary scientist at the University of Texas at Austin, said in a statement.
Reading crystals
Zircon crystals are tiny pieces of a superdurable mineral known as zirconium silicate. These crystals are scattered throughout most of Earth's rock formations, including most of the oldest known rocks on our planet. The near-industructible crystals are extremely useful to geologists because their internal structure preserves evidence of being exposed to extreme conditions, such as high temperatures and intense pressures.
Analyzing zircon crystals is now one of the primary methods of dating ancient meteor craters, and the technique has led to several other impact dates being revised. For example, in July, researchers in Australia revealed that the North Pole Dome crater was around 500 million years younger than initial studies predicted, and in 2025, experts found that the impact that birthed Scotland's Stac Fada Member structure happened around 200 million years later than earlier research estimated.
The internal structure of zircon crystals preserves evidence of being exposed to extreme conditions, such as high temperature and pressure, making them ideal for exploring ancient impacts. This photo, captured during a completely unrelated study, shows one such crystal under an electron microscope. (Image credit: Emmanuel Roquette via Wikimedia)
"These small crystals allow us to go back in time and learn about the major changes to Earth's ancient landscapes," study co-author Danny Stockli, a geologist and dean of the Jackson School of Geosciences at the University of Texas at Austin, said in the statement. "It would be great to do this for more of the meteor impact sites across the continent so we could get a more accurate timeline for these major events."
"This is where the impact belongs"
The crater's new age takes it firmly out of the Ordovician meteor event and places it into the Frasnian-Famennian mass extinction event, also known as the Kellwasser event or the Late Devonian mass extinction.
During the Frasnian-Famennian event, which began around 372 million years ago and lasted for several million years, as much as half of all marine life went extinct as Earth's oceans were depleted of oxygen. The die-off, which was most likely triggered by global cooling due to increased levels of volcanic activity, is often cited as one of the five major extinction events in Earth's history.
The researchers emphasized that the Ames impact was not the cause of the Frasnian-Famennian event. However, they noted that the fallout from the impact, which would have injected huge clouds of dust into the air, may have contributed to the atmospheric cooling effect in the region.
It is an important reminder that the ability to accurately date specific events like this can inform our understanding of wider global patterns and trends, the researchers wrote.
"With this research, we're basically taking a major pawn out of the Ordovician Meteor Event and dumping it into the Frasnian-Famennian event, and saying, 'This is where this impact belongs,'" Catlos said.
The new study was dedicated to co-authors Andrew Parisi and Michael Brookfield, who sadly died before it was published.
Live YouTube video presentation coming October 19th on the subject of human longevity. The ages of the biblical patriarchs are the data and they give us a clue into the potential age Adam could have lived. My new model also tells us how old modern humans could live. It is a must watch.
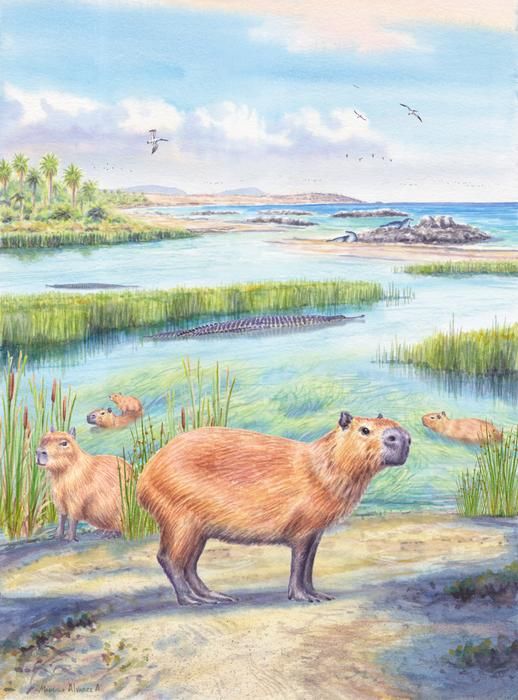
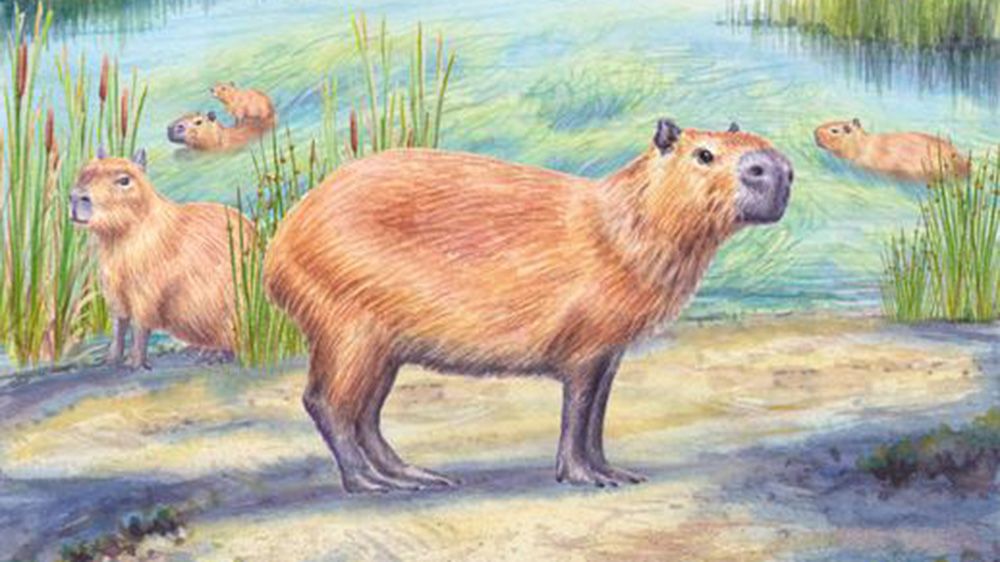
An illustration of ancient capybaras enjoying coastal wetlands, which may have looked somewhat like the Atacama Desert around 9 million years ago. (Image credit: Mauricio Alvarez)
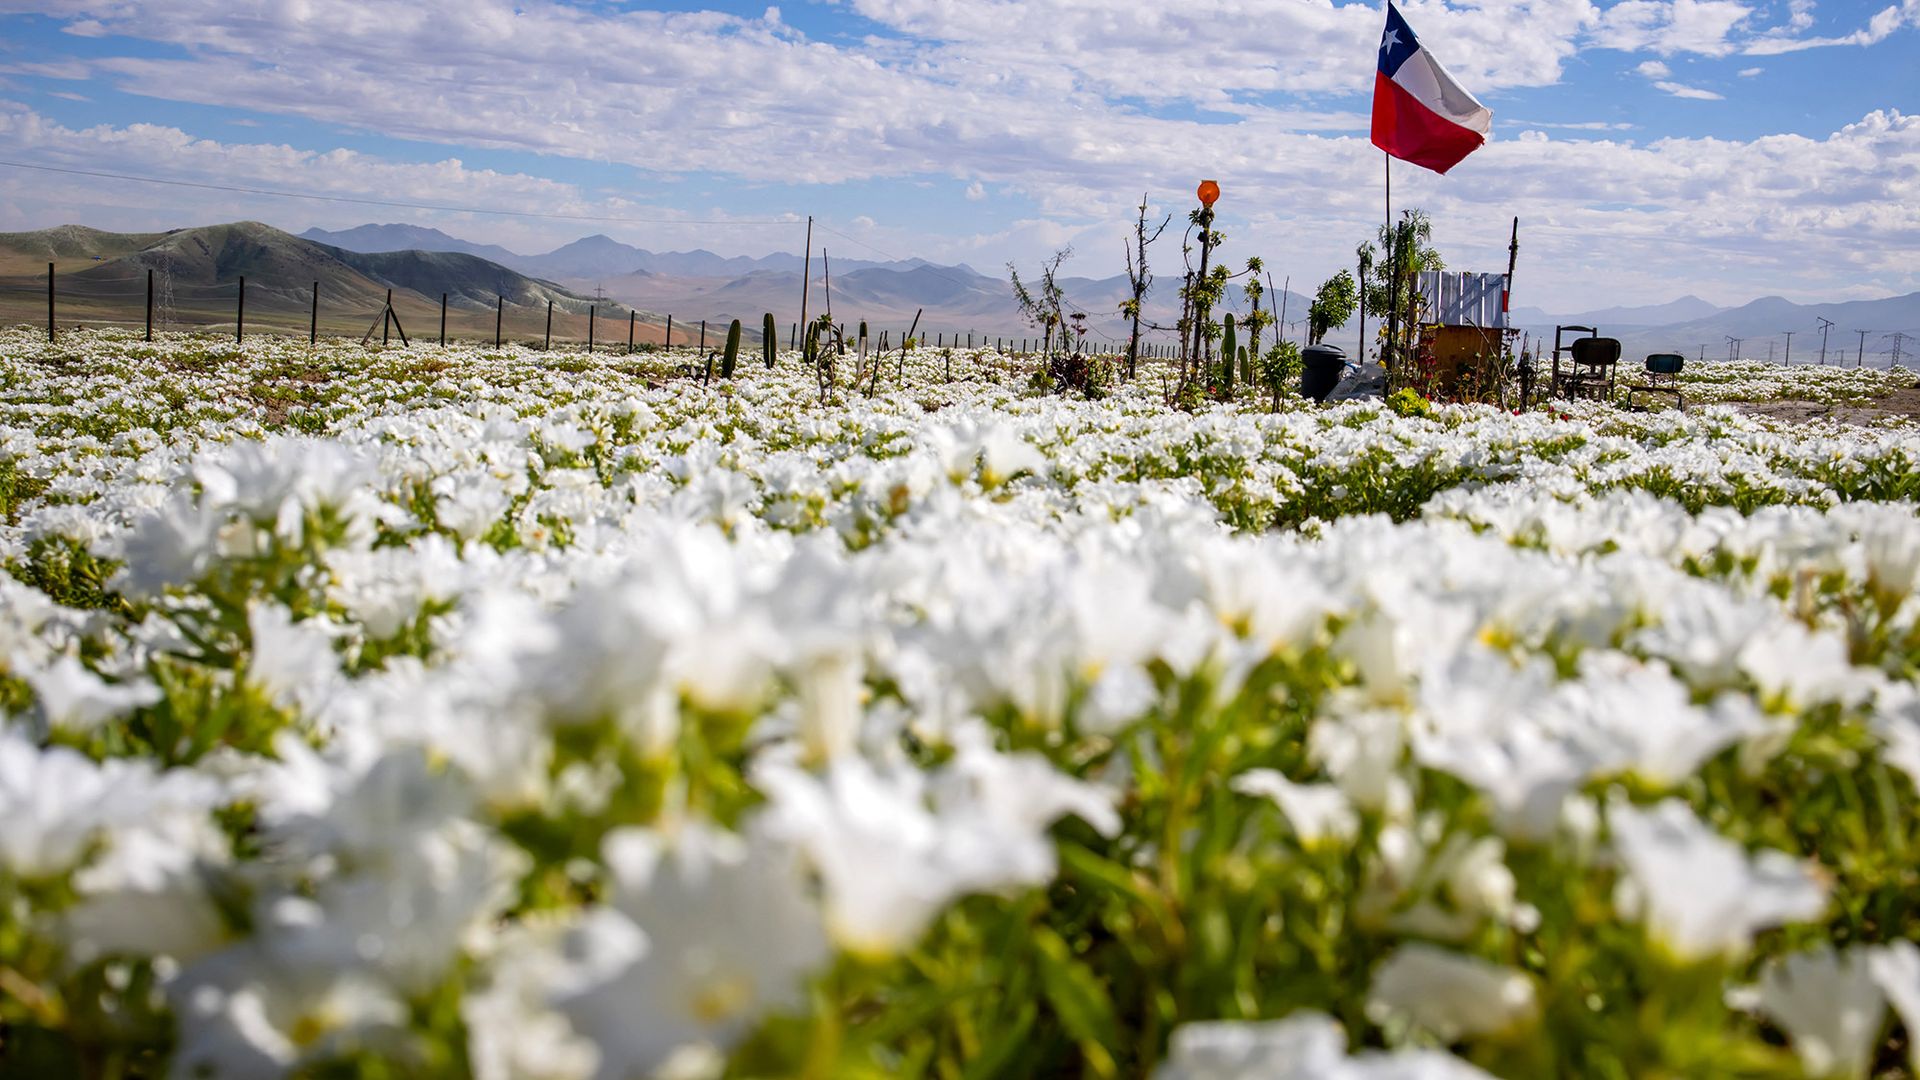
Researchers have discovered a roughly 9 million year old tooth belonging to a large, water-loving relative of modern day capybaras in the Atacama Desert of northern Chile. The fossilized molar adds to previous evidence suggesting that it's unlikely the Atacama, one of the driest places on Earth, was continuously dry for the last 40 million years.
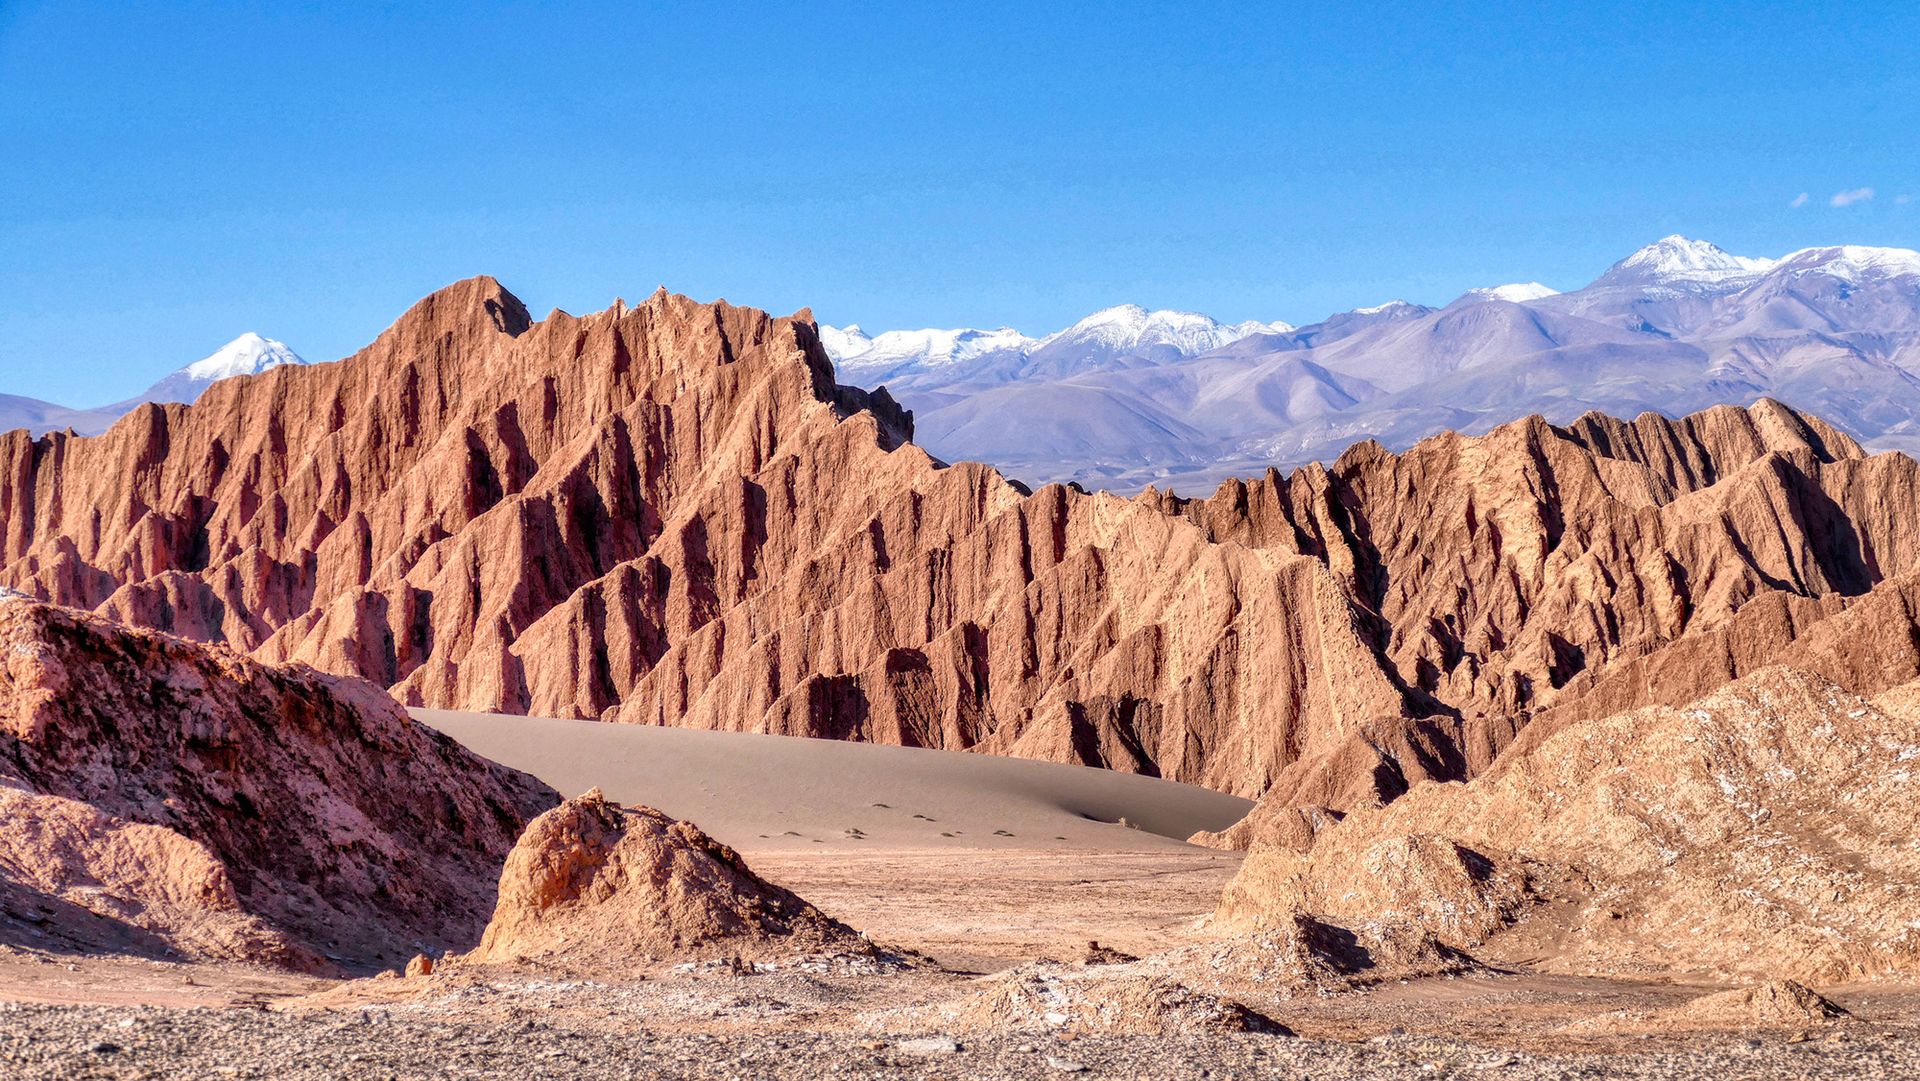
The Atacama Desert, possibly the oldest desert on Earth, takes up the northern third of Chile. It's bounded by the Chilean Coast Range to the west, which blocks rain from the Pacific Ocean, and the enormous Andes to the east, which obstruct rain from the Atlantic Ocean. The driest part of the desert's hyperarid region gets less than 0.08 inches (2 mm) of rainfall a month.
Recent research estimates the Atacama's hyperarid core started forming between 47.8 million and 33.9 million years ago, in the Mid- to Late-Eocene, 20 million years before the Andes formed. It suggests the mountain ranges weren't the cause for the desert's aridification, and may have only intensified it.
Capybaras (Hydrochoerus hydrochaeris) — the world's largest rodent — exclusively live close to stable freshwater sources and feed on plants that also require water to grow, so the discovery of an extinct capybara relative (Hydrochoerus Cardiatherium) tooth in the Atacama Desert is very strange.
"Finding a capybara tooth in a marine deposit in what today is one of the driest regions on Earth is just freakish," Priscilla Martinez, a geoscientist at the University of Arizona and co-author of a new paper describing the discovery, said in a statement.
Capybaras are native to South America, although today, they are not found in Chile, where the tooth was unearthed, according to the International Union for Conservation of Nature (IUCN).
Part of the Atacama Desert called Valle de La Luna, named because of the region's resemblance to the moon. (Image credit: Piero Damiani via Getty Images)
The tooth isn't the only clue that the Atacama was a wetter place in the late Miocene. Researchers found it in a layer holding the remains of a shallow marine environment that existed between 7 million and 10 million years ago, according to the statement. And they've also found microscopic pieces of plants, known as phytoliths, revealing that palm trees, grasses, gingers and other flowering plants grew there in what may have been a subtropical forest.
These findings and others are part of a growing body of evidence that the Atacama Desert was once wet enough for crocodiles and freshwater fish to thrive and palms to grow. The new study, published Sept. 5 in the journal Scientific Reports, shows that capybara relatives lived there as well during the late Miocene, which, because they are semiaquatic animals, is further evidence to support the hypothesis of a sporadically moist Atacama.
The researchers aren't sure how exactly capybaras moved into the Atacama Desert. Although there were capybaras in South America at the time, the Andes created an 18,000-foot-high (5,500 meters) barrier between their current habitats and the site where the tooth was found. The researchers theorized that, instead of traversing the mountains, the ancient capybaras migrated along the western coast of South America, following wetlands, rivers and other water sources.
According to Samantha Hopkins, an Earth sciences professor at the University of Oregon who was not involved in the study, it's unlikely the tooth found its way to the site without capybaras living there.
"If you wanted to find a way that this capybara could be here while the Atacama was still as dry as it is today, you'd have a hard row to hoe," she told Live Science in an email, because the size of the tooth makes it hard to transport it long distances. The desert wind couldn't have blown it such a long way, and while large carcasses can float down waterways for miles, "if you're going to invoke a large enough waterway to do this, you've demonstrated that the Atacama wasn't as dry as it is today anyway."
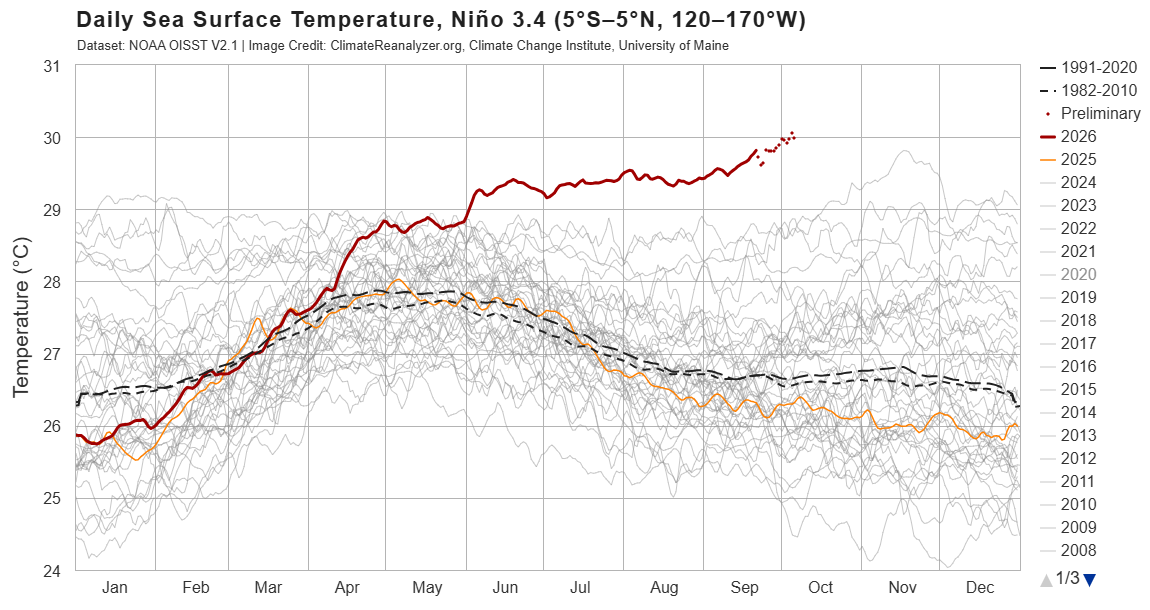
The sea surface temperature in a key section of the central equatorial Pacific Ocean has now surpassed all previous temperatures on record for this region, exceeding 86 degrees Fahrenheit (30 degrees Celsius) for the first time, according to preliminary data released Monday (Oct. 5).
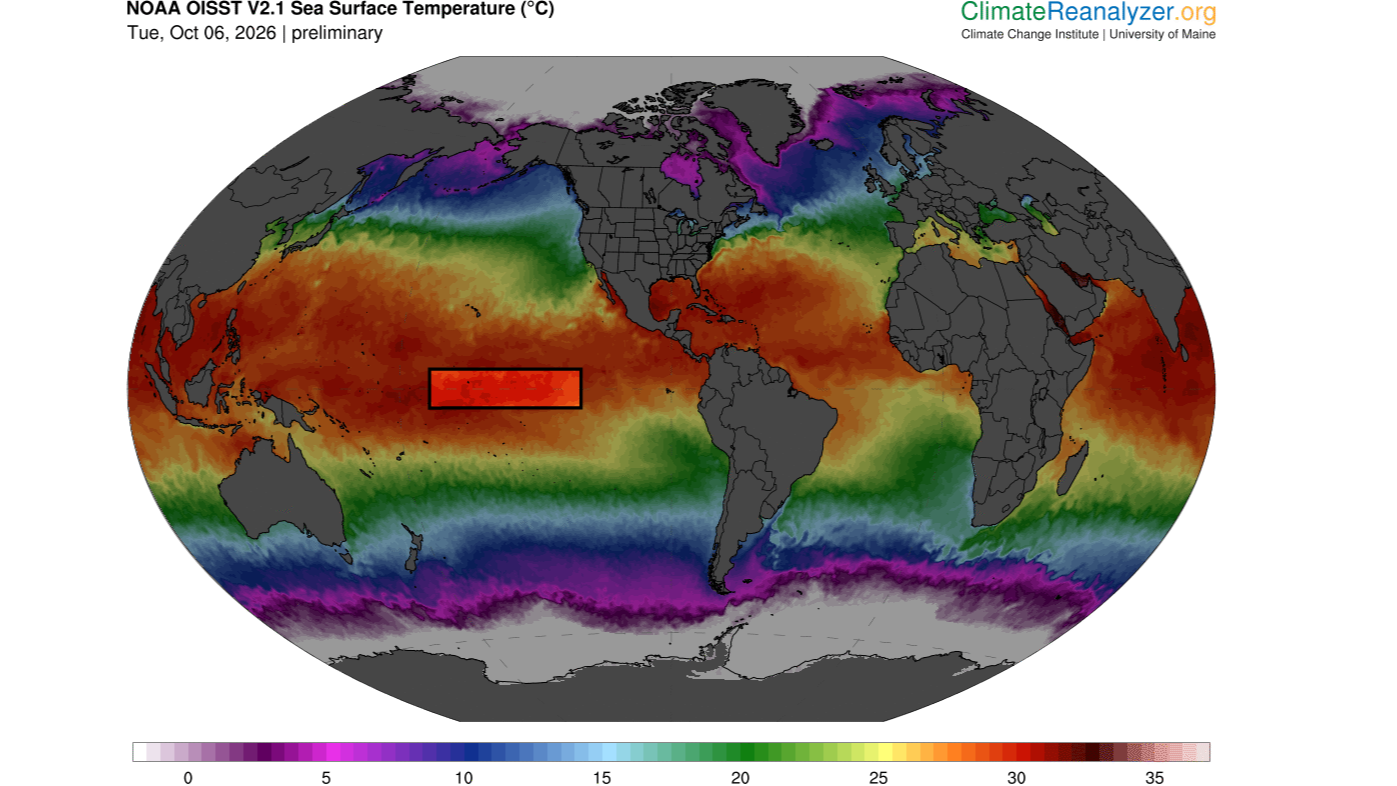
Specifically, these temperatures occurred in the Niño 3.4 region, located between 5 degrees north and 5 degrees south latitude, and 120 degrees west and 170 degrees west longitude. Researchers use this region to monitor the progression of El Niño, the warm phase of a multiyear natural climate pattern that's currently in full swing and steadily intensifying. But how significant is this new record, and could it be a harbinger of increasingly extreme El Niño events in the future?
At this time of the year, sea surface temperatures above 86 F are common in the western Pacific warm pool, a mass of water located northeast of Australia. But the Niño 3.4 region is nowhere near the warm pool and usually has much cooler temperatures. This latest data indicates "an exceptionally warm state for this part of the tropical Pacific," said Jin-Yi Yu, a professor of Earth system science at the University of California, Irvine.
"If the reported daily El Niño 3.4 temperature above 30°C is verified in the observational dataset, it would be an extraordinary record," Yu told Live Science in an email.
Other experts agreed. A Niño 3.4 sea surface temperature above 86 F is a "very significant" new record, Timothy Osborn, a professor of climate science and the director of the Climatic Research Unit at the University of East Anglia in the U.K., told Live Science in an email. Mat Collins, a professor of climate systems and the head of mathematics and statistics at the University of Exeter in the U.K., also called the temperature "very significant" in an email to Live Science.
But it's important to note that absolute temperature is not the standard way of measuring the strength of El Niño, Osborn said. Researchers usually assess El Niño intensity by comparing sea surface temperatures in the Niño 3.4 region with the average conditions there or with sea surface temperatures across the rest of the tropics, with the latter method removing a skew in the data caused by the climate-change-induced heating of oceans globally.
"On those measures, the current event is already close to being the strongest [El Niño] on record and will likely soon exceed previous records given that the event is forecast to strengthen further," Osborn said. "For some measures, it is already record-breaking for the time of year."
"Super" El Niño
El Niño events happen when warm water in the western tropical Pacific Ocean migrates eastward along the equator, toward South America. This boosts global temperatures, triggering heavy rainfall and floods in regions like East Africa, southern China, the southern U.S. and the Pacific coast of equatorial South America, while places such as Indonesia, the Philippines, southern Africa and northern South America experience drought.
"El Nino impacts are greatest across the tropics and in the lands around the Pacific Ocean," Osborn said. "An El Nino with record strength is very significant because it greatly disrupts the atmospheric circulation which controls the weather patterns including patterns of rainfall."
As of Oct. 6, the temperature anomaly in the Niño 3.4 region is 6 F (3.34 C) above average and rising. A typical El Niño increases Niño 3.4 temperatures by a maximum of 1.8 to 3.6 F (1 to 2 C) above average, so the current condition is "exceptionally large," Yu said. "This indicates that a very strong, or what is sometimes called a 'super,' El Niño is developing."
Sea surface temperatures in the Niño 3,4 region exceeded 86 degrees F (30 C) on Oct. 5. (Image credit: ClimateReanalyzer.org (CC BY 4.0))
This year's El Niño is being amplified by human-driven global warming, which has increased background ocean temperatures. As a result, it's likely that sea surface temperatures in the Niño 3.4 region will keep rising over the coming weeks and peak in November or December, before declining again in 2027, Collins said.
While it's likely that future El Niños will be more extreme than past ones, on average, not every El Niño will be record-breaking and as dramatic as the one unfolding now, because these events tend to be very variable, Collins said.
As climate change intensifies, the big worry is that certain regions will be primed for extreme conditions even before an El Niño strikes, Osborn said. For example, regions that are getting drier due to global warming could see catastrophic droughts if they overlap with areas that experience dryness during El Niño events. Likewise, places that are getting wetter could see worse deluges of rain and flooding if they coincide with areas with higher precipitation during El Niños. But that doesn't necessarily mean extreme El Niños are the new normal, he said.
Instead, the location and duration of El Niño events may be transforming, Yu suggested. "In research by my group and collaborators, we have documented changes not only in El Niño intensity, but also in where the warming occurs and how long events persist," he said.
Yu and his colleagues helped to introduce the idea that we are seeing the emergence of two distinct types of El Niño: the eastern Pacific El Niño and the central Pacific El Niño. "Many El Niño events in the earlier observational record were dominated by warming in the eastern tropical Pacific, whereas Central Pacific El Niño events became much more prominent in recent decades," he explained, adding that El Niños have also been lasting longer.
Global warming may be creating a new kind of El Niño by strengthening atmosphere-ocean interactions in the subtropical Pacific, Yu said. If these interactions combine with processes in the equatorial Pacific, where eastern Pacific El Niños emerge, they might trigger unusually strong events with extreme heating in the central Pacific.
"That provides a physical reason to take the possibility of more frequent extreme El Niño events in a warmer climate seriously," Yu said. "But I would distinguish that from saying that every El Niño will become progressively stronger."
As the "super" El Niño is predicted to bring heavier storms and flooding to the U.S., experts recommend stocking up on food and other supplies. Floods and other disasters, like wildfires, are on the rise due to climate change, making disaster preparedness essential.
Preparedness levels vary; some people keep an emergency kit full of food and first-aid supplies, while others have a planned meeting place designated as a safe space. Having a plan can help people feel better about unpredictable events. But not everyone has thought this far ahead.
Live Science recently asked readers how prepared they are for a natural disaster and what sort of plans or supplies they have on hand. Over 130 people responded to the poll, with 51% of readers choosing "I've got an emergency kit ready for when the unexpected happens."
The comments reflected this majority, as one reader wrote, "We're on the edge of an area at risk for grass fires, so we bought/stocked an RV as an emergency bugout vehicle. Felt extreme initially, less so as time goes by. Gives us 3-5 days of margin before we need to resupply, with food, water and first aid for people and dogs."
Another commenter responded to the rest of the comments, writing, "This is just the begining [sic]. Get a greenhouse, plant food, learn to harvest water, build an outside toilet (for later), learn to be self sufficient. trade with your neighbors. Plant fruit trees, get solar panels and an electric transporation (bike, car whatever). Keep a de humidifier in your home. it's back to the 1930ie[s]."
Do you agree with these readers? Let us know in the comments section.
What's in the photo? A "sunglint" transforming a reservoir into a giant silver river
Who took the photo? An unnamed astronaut on board the International Space Station
When was it taken? 2016
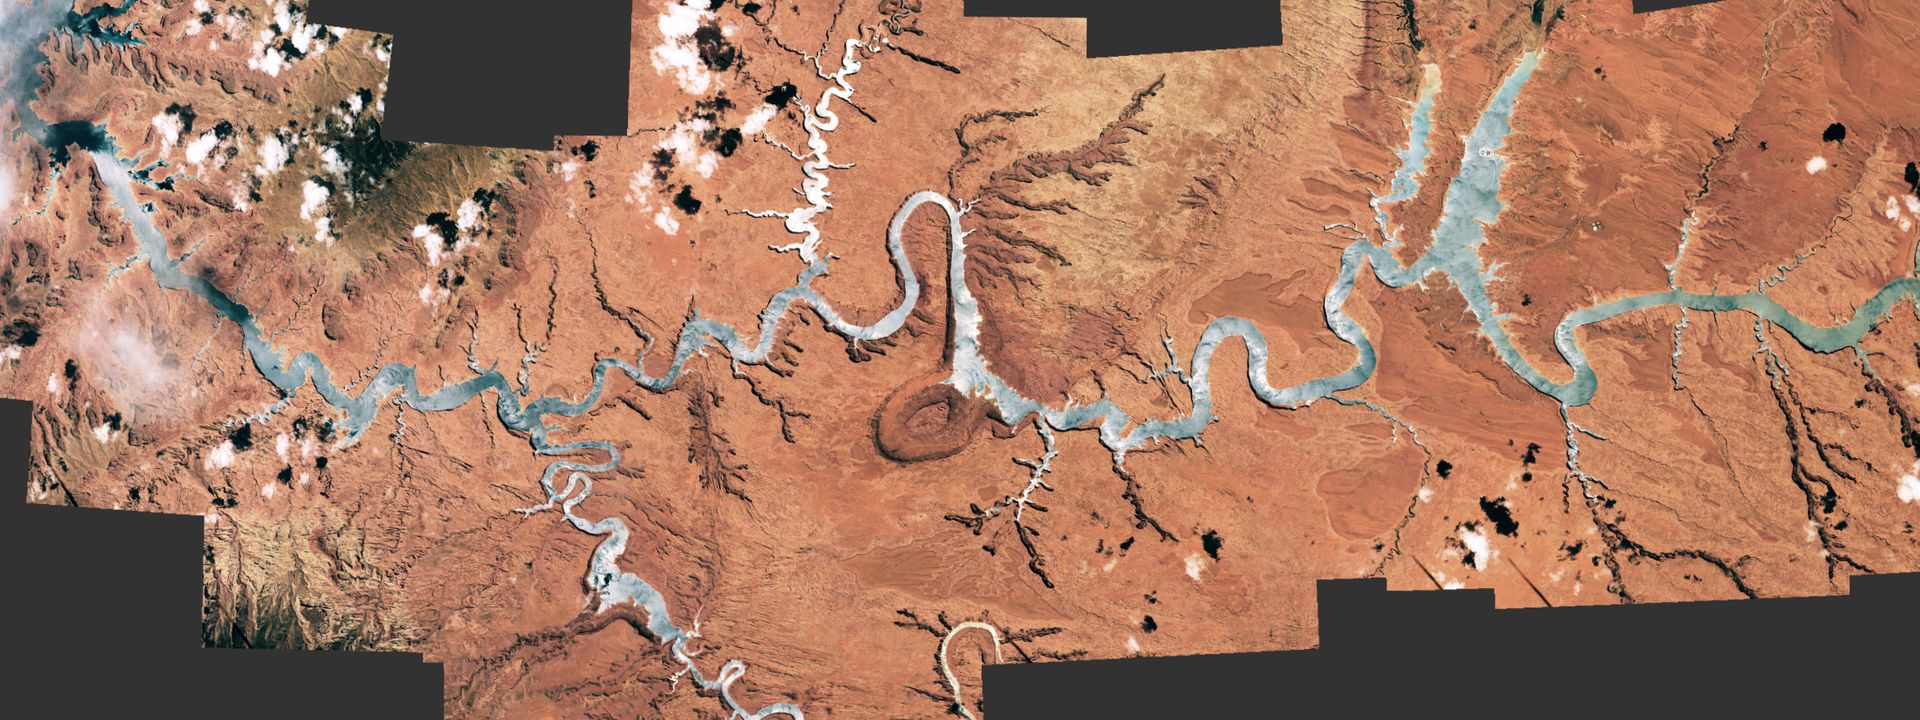
This eye-catching astronaut photo mosaic shows a rare "sunglint" transforming a snaking reservoir into a giant silver river.
The winding waterway at the heart of this image is a section of Lake Powell in southern Utah. The artifical reservoir starts around 70 miles (110 kilometers) southwest of the town of Moab and ends roughly 60 miles (100 km) northeast of the Grand Canyon in Arizona. When full, Lake Powell holds up to 1.2 billion cubic feet (33.3 million cubic meters) of water, making it the second-largest reservoir in the U.S. — close behind the nearby Lake Mead, which stretches across the Arizona-Nevada border.
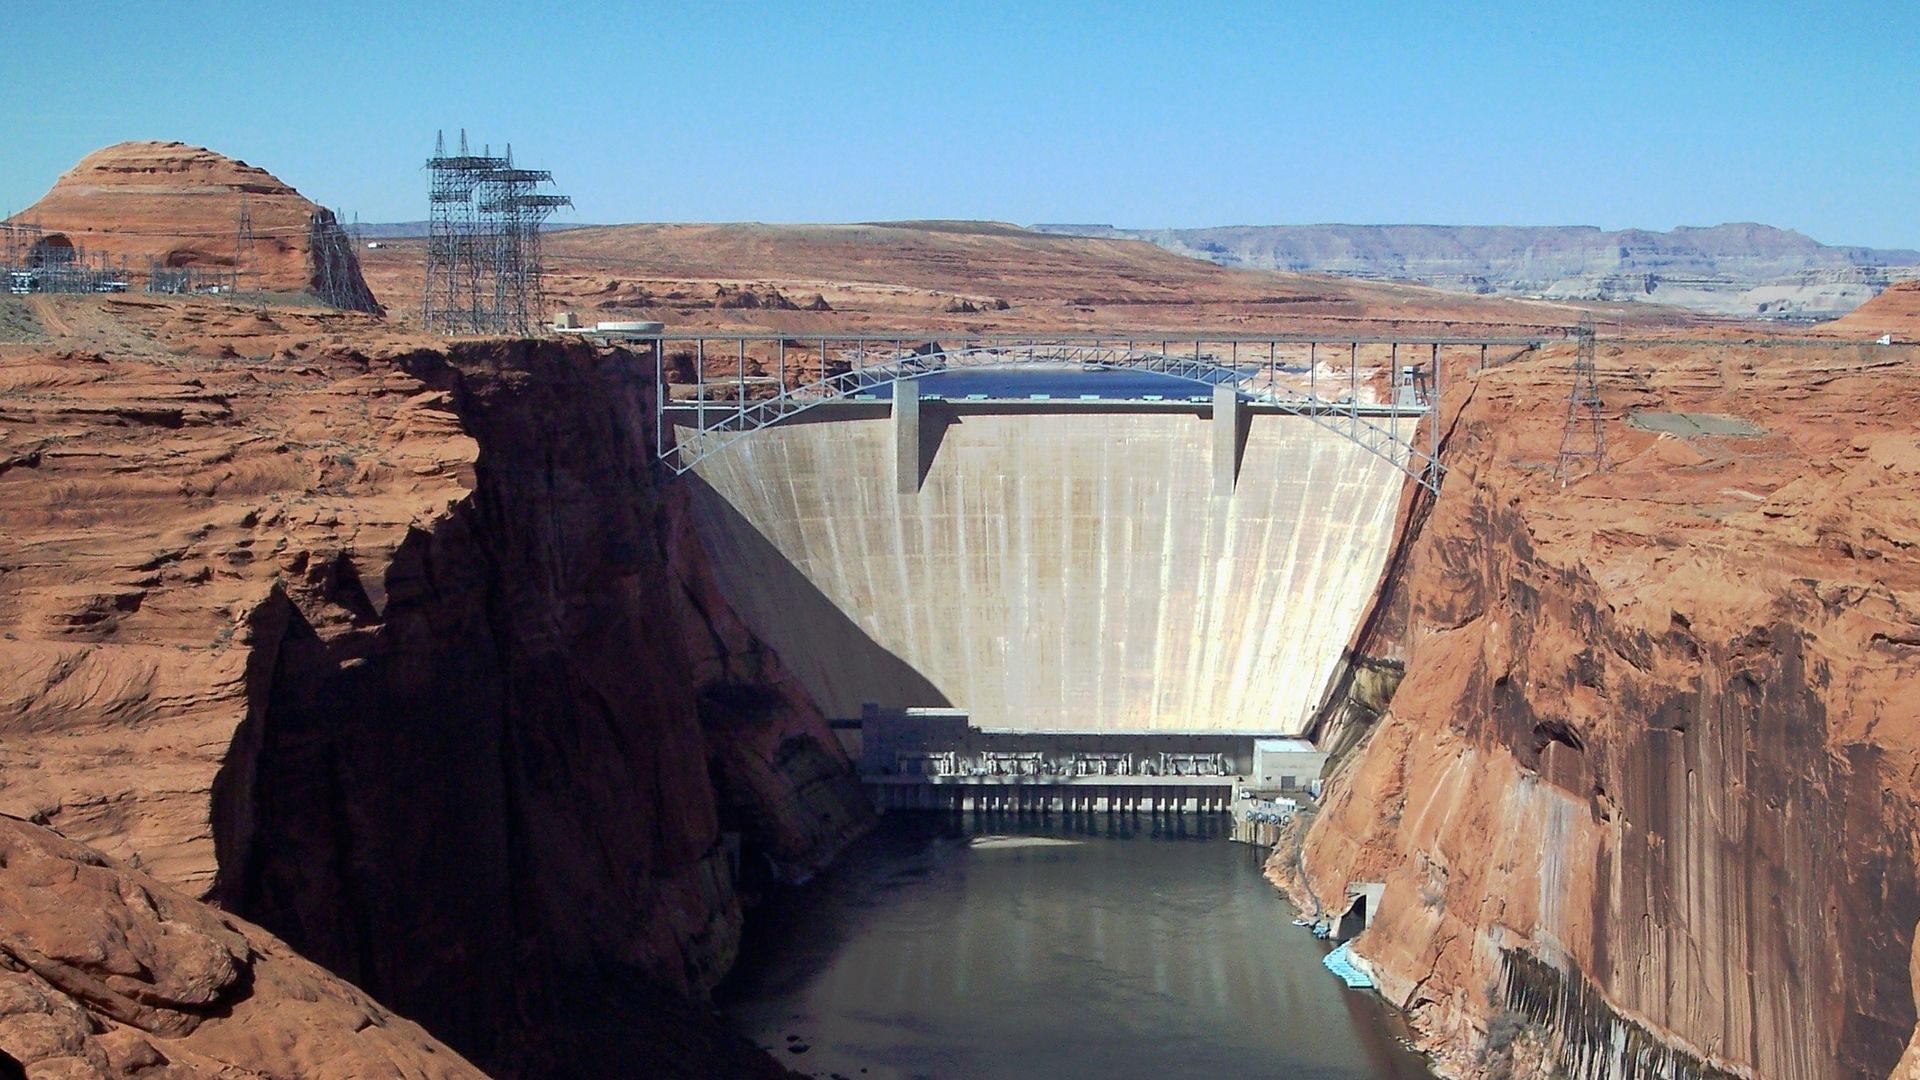
Lake Powell is located on the Colorado River, inside a steep ravine known as Glen Canyon. The reservoir emerged in the 1960s, following the construction of the Glen Canyon Dam, which caused water levels to rise by around 200 feet (60 meters) over the next two decades. In addition to generating hydroelectric power, the artificial lake has become a popular tourist destination. (Lake Mead is also located along the Colorado River and was created by the construction of the Hoover Dam.)
Normally, this effect would be visible only across a small section of the lake. But by combining photos taken as the sunglint moved along the reservoir's length, the entire body of water was illuminated.
Lake Powell was created by the Glen Canyon Dam in northern Arizona. It took around 17 years for the reservoir to fully fill after the barrier's construction was completed in 1966. (Image credit: Adbar via Wikimedia)
The reservoir is named after John Wesley Powell, an explorer and former director of the U.S. Geological Survey, who mapped out Glen Canyon and other parts of the Colorado River in the late 1860s. Powell was particularly captivated by Glen Canyon, which contained a "labyrinth of overhanging cliffs, hanging gardens, sweeping river bends, and natural arches set amidst a backdrop of colorful buttes and mesas," Earth Observatory representatives wrote.
Powell later described his recollections of the canyon. "Past these towering monuments, past these mounded billows of orange sandstone, past these oak-set glens, past these fern-decked alcoves, past these mural curves, we glide hour after hour, stopping now and then, as our attention is arrested by some new wonder," Powell wrote in his 1875 book "Canyons of the Colorado."
Some of the sights that Powell marveled over still exist, including many smaller canyons that branch off the reservoir and are cast in deep shadow. A similar effect is seen in sections of Utah's Green River, a tributary of the Colorado River that has long perplexed geologists due to its ability to flow "uphill."
From above, one of the canyon's most striking geological features — a large, doughnut-shaped depression known as The Rincon — is visible as a dark ring surrounding a bend along one of the widest sections of the lake. This rusty doughnut, which is up to 3 miles (5 km) across, is a former section of the Colorado River that dried out thousands of years ago when part of the canyon collapsed, enabling water to bypass the rocky loop.
Glen Canyon is home to many geological features that have since been submerged by Lake Powell. This photo shows a section of the canyon downstream from the dam, where these features are still mostly exposed. (Image credit: Vicki Jauron, Babylon and Beyond Photography via Getty Images)
However, many of the other wonders that Powell described have been lost beneath the reservoir's elevated water level. These include a side canyon dubbed the Music Temple, which was shaped in a way that gave it remarkable acoustic properties, according to the Earth Observatory.
During periods of drought, when the reservoir's water levels temporarily drop, other lost geological treasures can be exposed. For example, in 2023, researchers found rare fossils from a mammal-like Jurassic creature lurking beneath the lake's high-water line.
In recent years, some environmental groups have petitioned to drain Lake Powell and return Glen Canyon to its former glory as the "heart of the Colorado River," according to Newsweek. Such a change may help to alleviate pressure on the rest of the river, which has lost a significant amount of water in recent decades. But experts told Newsweek that this is unlikely to happen.
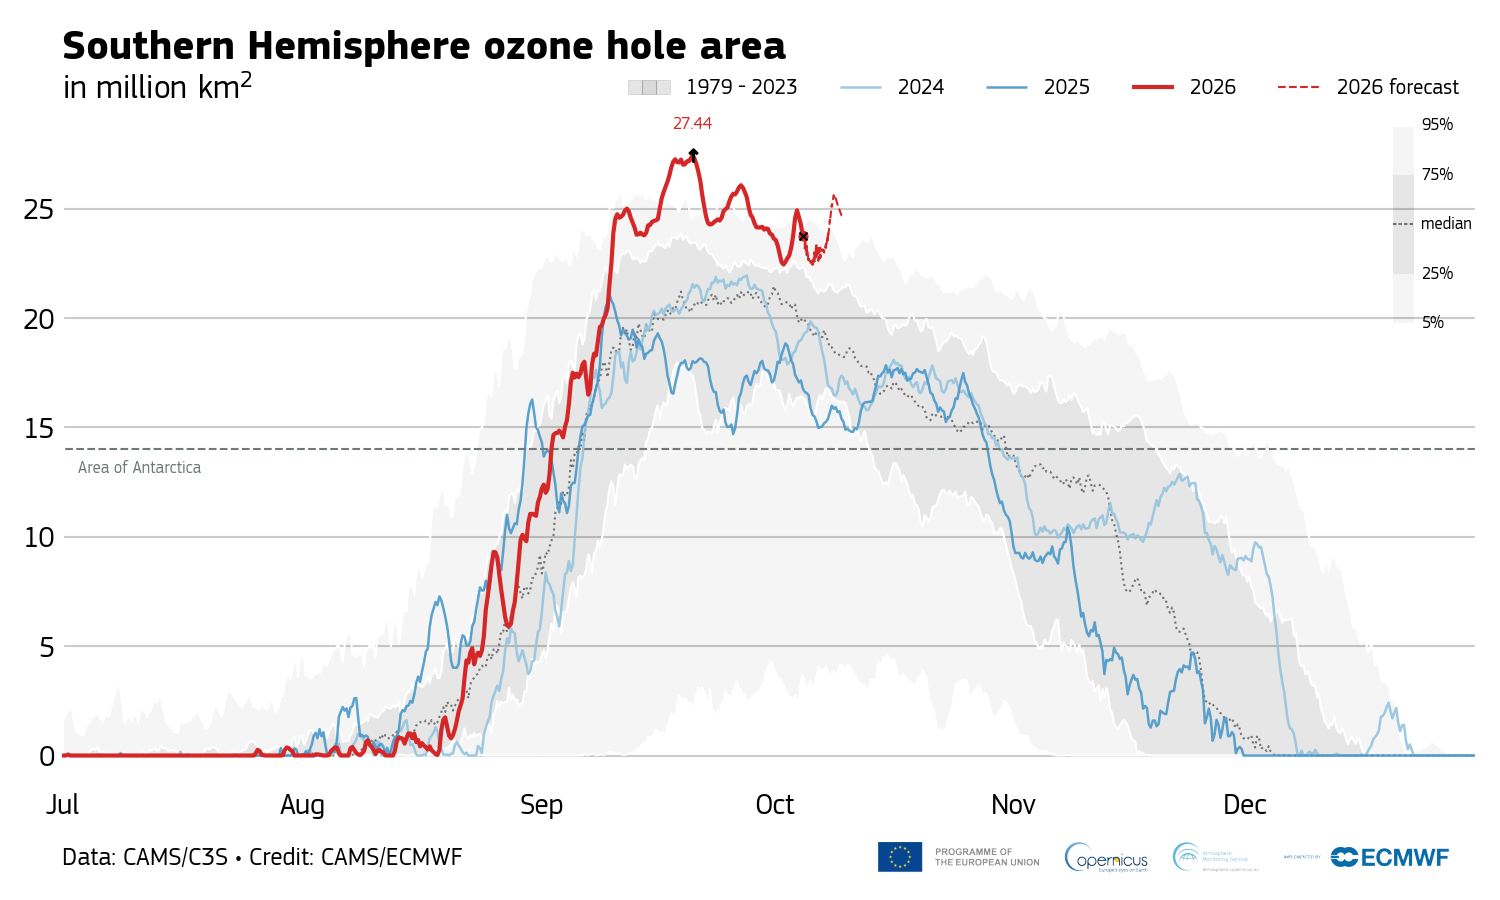
On Sept. 20, the Antarctic ozone hole peaked at 10.6 million square miles (27.4 million square kilometers), the second-largest size ever observed for this time of the year.
The last time the ozone hole was this big was in October 2015, when it reached a whopping 10.8 million square miles (27.9 million square km), records from the Copernicus Atmosphere Monitoring Service show. So why is the hole in the ozone layer — the shield that protects life on Earth from harmful ultraviolet solar radiation — so big this year, despite other clues telling scientists that it is recovering as expected from the damage human-made chemicals did in the 20th century?
The ozone hole's extent is due to extremely low temperatures in the stratosphere, but it's also possible that we could be seeing a new long-term trend of large, persistent holes, experts told Live Science.
"This year's ozone hole shouldn't be a cause for alarm," Hannah Kessenich, a postdoctoral physicist at the University of Otago in New Zealand who predicted the 2026 ozone hole's extent using satellite data and a computer model, told Live Science in an email. "However, there are still many unanswered questions. It's something we need to keep a close eye on."
Accurate predictions
The latest figures from the Copernicus Atmosphere Monitoring Service indicate that the size of Antarctica's ozone hole has dropped to around 8.9 million square miles (23 million square km) since Sept. 20, making it unlikely that this year will break the 2015 record. However, scientists think the hole will remain large and fluctuate over the next few weeks, Kessenich said.
Antarctica's 2026 ozone hole peaked Sept. 20 and has been shrinking since. (Image credit: Copernicus Atmosphere Monitoring Service)
Antarctica's ozone hole expands every year during the Southern Hemisphere's winter and spring. It typically reaches its maximum size between mid-September and early October, when temperatures are still freezing in the stratosphere and sunlight illuminates the frozen continent for the first time after months of darkness. The hole then shrinks again until late January as surrounding ozone-rich air mixes into the depleted region.
Antarctica's ozone hole was caused by emissions of ozone-destroying chlorofluorocarbons (CFCs) between the 1930s and late 1980s. These chemicals increased concentrations of chlorine in the stratosphere, thereby promoting a reaction that depletes the ozone layer. While countries signed the Montreal Protocol to phase out CFC use beginning in 1989, major CFCs have atmospheric lifetimes of 50 to 100 years, so the hole's recovery could take six decades, researchers estimate.
The ozone layer is particularly vulnerable above Antarctica due to the frigid conditions in the polar stratosphere. Temperatures below minus 108 degrees Fahrenheit (minus 78 degrees Celsius) trigger the formation of high-altitude clouds, whose icy surfaces turn inactive chlorine into its ozone-destroying form in the presence of sunlight. These conditions don't exist to the same extent in the Arctic, because warmer air from the midlatitudes mixes more readily with cold Arctic air than with Antarctic air, thereby blocking the formation of high-altitude clouds.
Changes in the polar vortex
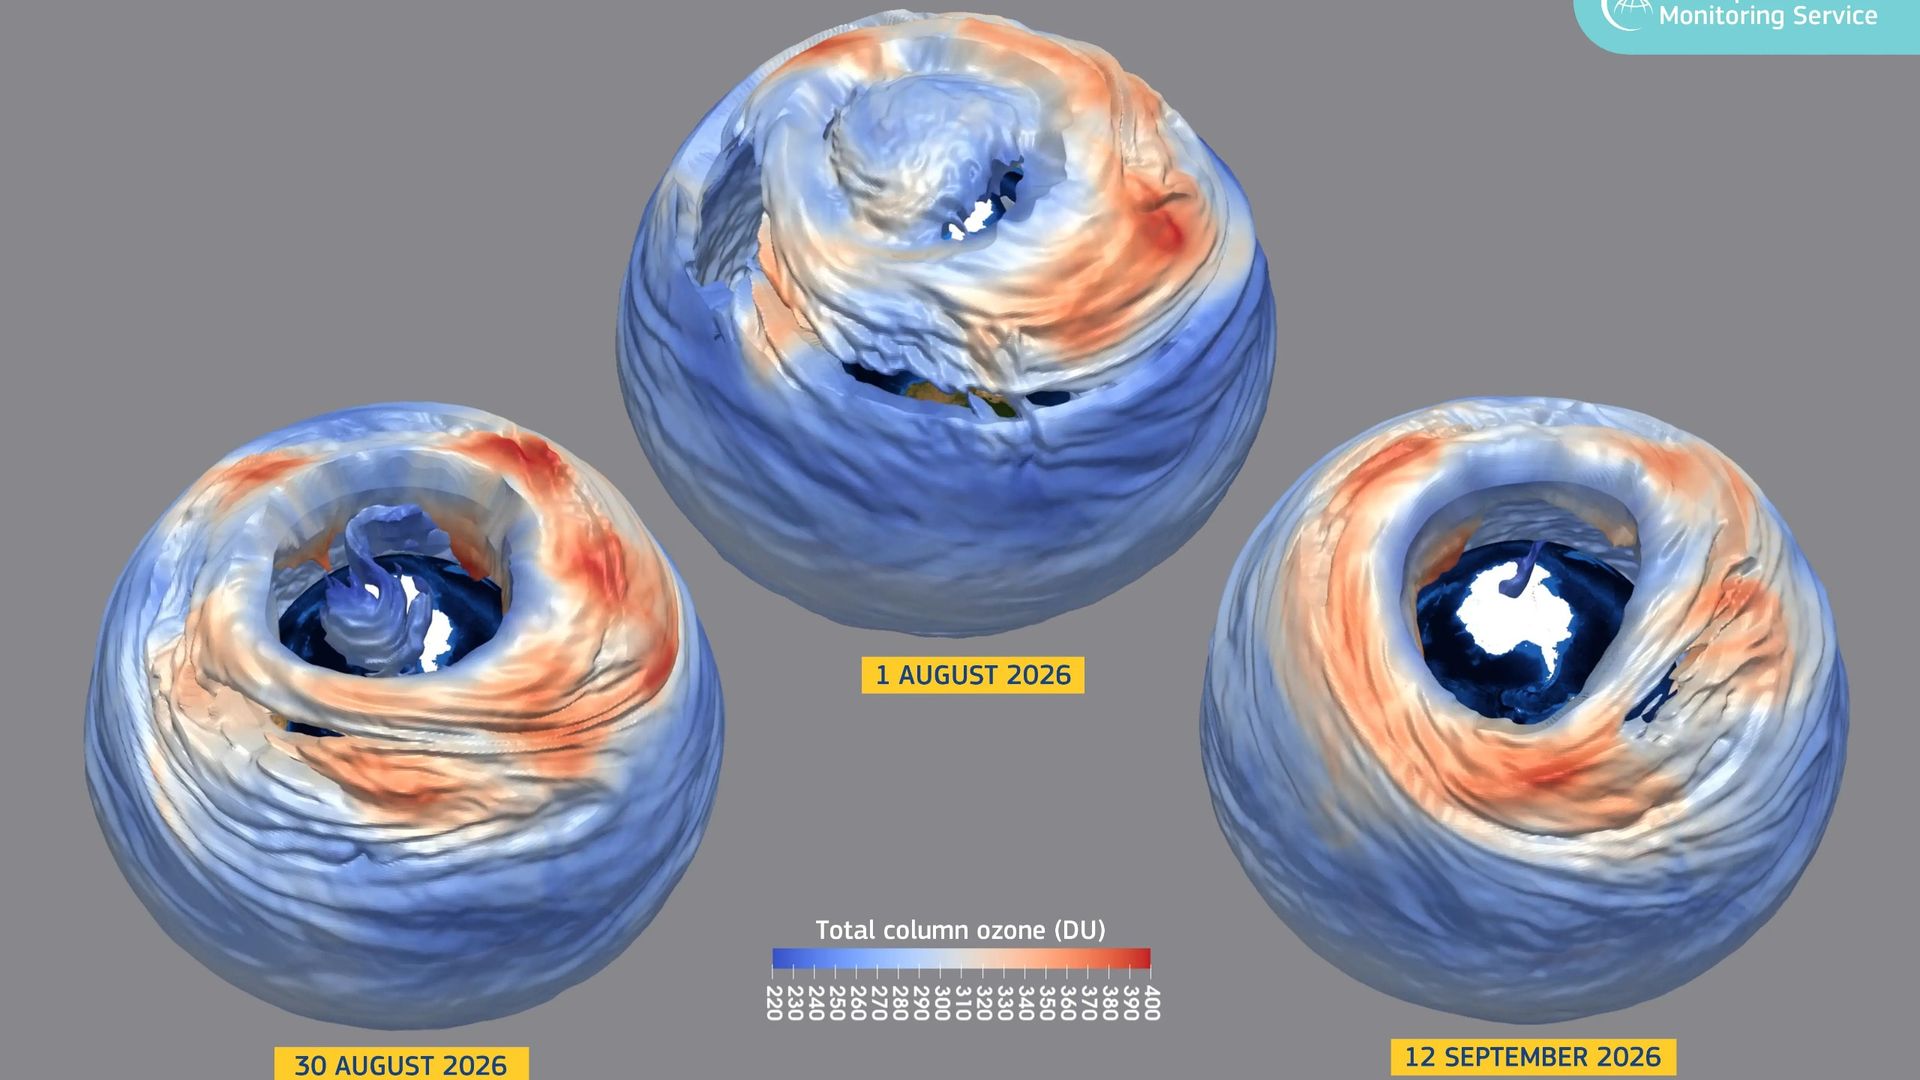
This year's large ozone hole is caused by a very strong polar vortex, a wall of wind that encircles Antarctica and the Southern Ocean in the winter, trapping cold air above the continent. The polar vortex created colder-than-usual conditions in the stratosphere over Antarctica, accelerating the growth of the ozone hole.
We have to look at the longer term trends, and those metrics continue to tell us that the ozone hole is slowly recovering as expected.
Susan Solomon, professor of chemistry and environmental studies at MIT
Researchers haven't detected an increase in reactive chlorine, but the colder polar vortex has triggered more ozone depletion than usual, said Susan Solomon, a professor of chemistry and environmental studies at MIT who pioneered the study of Antarctica's ozone hole in the 1980s.
This size of this year's ozone hole is most likely a product of natural variability in atmospheric dynamics, Kessenich said.
"We expect ups and downs in the size of the hole from year to year," Solomon told Live Science in an email. "A year or a few years of bigger or smaller holes doesn't tell us anything about ozone loss or recovery; it is just variability. We have to look at the longer term trends, and those metrics continue to tell us that the ozone hole is slowly recovering as expected."
It's also reassuring that the ozone hole, while large, isn't as "thin" as in years past. The hole's extent is calculated based on the area above the continent with ozone values below 220 Dobson units, a measure of how many ozone molecules occur in a vertical column through Earth's atmosphere. Although the area of this year's ozone hole is huge, ozone values haven't dropped as low as in previous big-ozone-hole years, suggesting that there is less ozone "missing" from the hole compared with those years, Kessenich and her colleagues wrote in The Conversation.
But there's also the possibility that we've shifted to a new long-term trend of big ozone holes persisting until late spring, Kessenich said. Changes in global atmospheric dynamics unrelated to CFCs could be making longer-lived holes more likely, she and her colleagues wrote in the article.
There is also some evidence that climate change will strengthen the Antarctic polar vortex over time, which could lead to colder temperatures in the stratosphere and greater ozone losses in the spring, Kessenich said. If this year's polar vortex stays robust, the ozone hole could remain large well into November, she noted.
"It's too soon to tell what has been driving dynamical variability in recent years, but more research is needed," she added.
This year's exceptionally strong El Niño has brought a rare gift to Chile's Atacama Desert: rain. In one of the driest places on Earth, that rare moisture has awakened millions of seeds and bulbs that can remain dormant underground for years, transforming the landscape into a spectacular carpet of color.
Known locally as "desierto florido," or "flowering desert," the phenomenon is one of nature's most remarkable transformations. Patches of purple, pink, white, red and yellow now spread across hillsides and plains that for much of the year appear almost completely lifeless.
"It is a unique phenomenon; there are more than 200 plant species," Jorge Carabantes, head of the Protected Areas Department at the National Forest Corp. (CONAF) in Chile, told The Associated Press. "This is a flowering event that is obviously extraordinary and unusual, very different from other blooms that occur elsewhere on the globe."
Typically, the Atacama gets just 0.6 inches (15 mm) of rain a year. But thanks to the super El Niño, record levels of rain fell between July and August in several Chilean regions, including levels not seen since the 1950s, with some areas receiving more than 7 inches (190 millimeters), Carabantes told the AP.
While this unprecedented precipitation has caused flooding in some areas of Chile, it's created a 6,560-square-mile (17,000 square kilometers) swath of flowering blooms across the Atacama Desert. This is the most extensive desert bloom since 1997, CONAF representatives told the AP.
For photographers and tourists, the landscape is breathtaking, with bright colors contrasted against the dark Atacama mountains and Chile's cloudless skies. But the bloom is fleeting; by the end of the Southern Hemisphere's spring, many of the flowers will disappear, leaving behind seeds and bulbs waiting for the next extraordinary rains.
Here are five photos from Getty Images photographer Javier Torres that showcase the beauty of this rare event.
Flowers bloom on the plains near the Atacama Desert near Copiapó, Chile, with the Chilean flag in the background. (Image credit: JAVIER TORRES via Getty Images )
Tourists admire the purple blossoms of the desert flowers. (Image credit: JAVIER TORRES via Getty Images)
The plains of the Atacama Desert are carpeted by brilliant blooms, with the mountains in the distance. (Image credit: JAVIER TORRES via Getty Images)
A rainbow glows over purple flowers in Chile's Atacama Desert. (Image credit: JAVIER TORRES via Getty Images)
Cacti mix with blooming wildflowers in the Atacama Desert. (Image credit: JAVIER TORRES via Getty Images)

 Login