❌

Normal view

A New Look at a Centuries-Old Solar Eclipse

23 September 2026 at 17:00

phases of a total solar eclipse

Humans have recorded solar eclipses for thousands of years. Recently, researchers translated and analyzed solar eclipse observations from 18th-century Sweden to determine the Sun’s radius at that time and study the first confirmed record of solar prominences.

Looking Back Nearly 300 Years
map showing the path of a solar eclipse

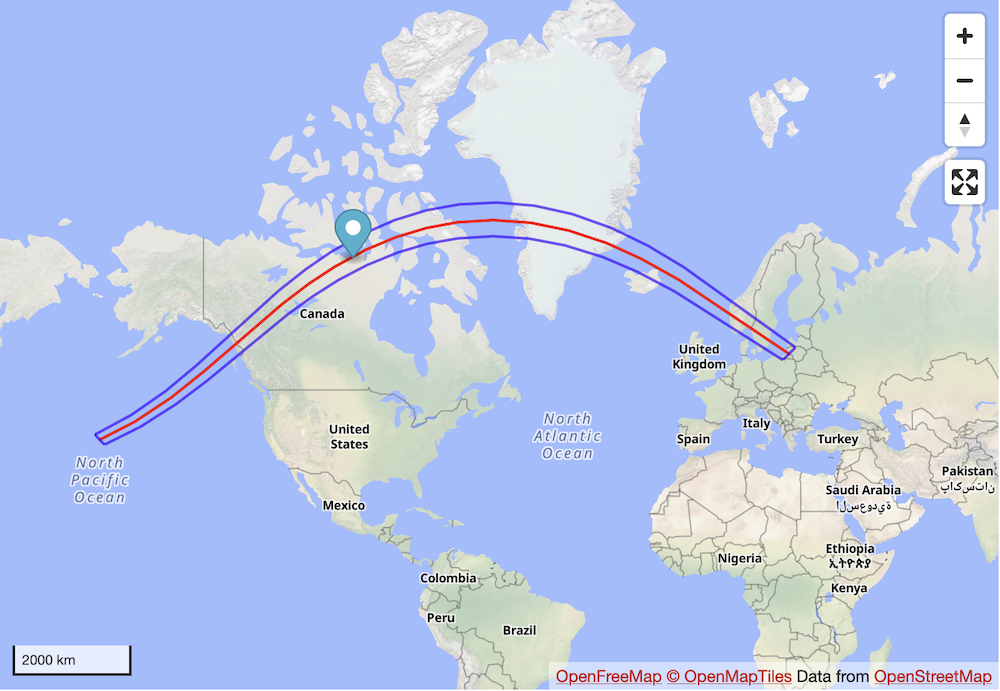
The path of the 13 May 1733 total solar eclipse. Click to enlarge. [Eclipse Predictions by Fred Espenak (NASA’s GSFC)]

On 13 May 1733, a solar eclipse darkened skies across a swath of modern-day Canada, Greenland, Iceland, and Scandinavia. Among the eclipse’s careful observers was Swedish astronomer and mathematician Birger Wassenius, who dutifully sketched the eclipse and the massive loops of plasma and magnetic fields — solar prominences — that bulged out from behind the Moon’s obscuring disk.

Wassenius penned a short account of his observations in Latin for Philosophical Transactions of the Royal Society (the longest-running scientific journal in the world!). His drawings of the event, which include the first robust record of solar prominences, were never officially published, but were housed in the Royal Academy Archives of Sweden. Now, researchers have translated Wassenius’s full report from Swedish to English and analyzed his sketches, helping to fill an important gap in the historical record of solar activity.

Drawing from Observations

Hisashi Hayakawa (Nagoya University; Rutherford Appleton Laboratory) and collaborators translated Wassenius’s notes, which describe how he viewed the eclipsed Sun through a 21-foot-long telescope during just over two minutes of totality. From Wassenius’s measurements, Hayakawa and coauthors calculated the solar radius to be 696,250 ± 170 km; this is larger than the modern accepted radius, but it’s in line with what has been calculated from solar eclipse measurements two decades earlier, in 1715.
sketch of a solar eclipse

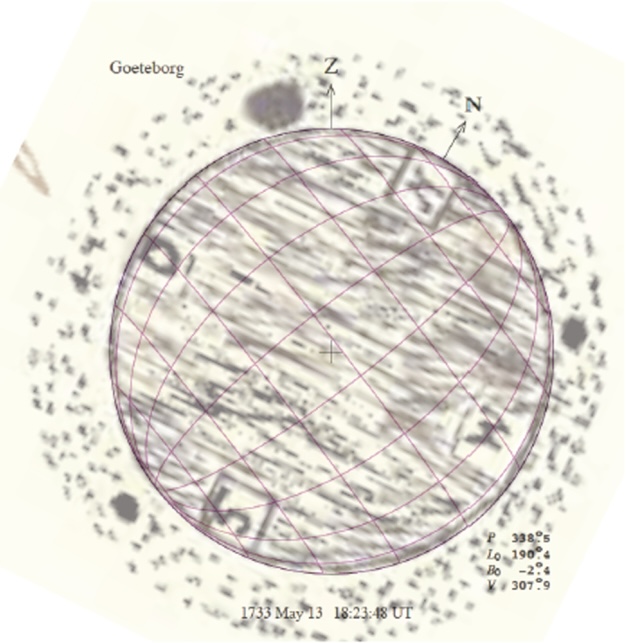
Wassenius’s sketch of the solar eclipse, showing three prominences as filled circles emerging from behind the disk of the Moon. [Adapted from Hayakawa et al. 2026]

Wassenius also made several sketches of prominences hovering above the edge of the Sun. While assessing these drawings, Hayakawa and coauthors had to contend with the imperfections of these hand-recorded features. With a narrow field of view that prevented him from seeing the entire disk at once, and with his time limited by the brief eclipse, Wassenius scribbled in two of the three prominences after the fact, from memory. After assigning reasonable uncertainties to the positions of these prominences, the team determined that at least one of these features was located at a high latitude.

Prominent Features

High-latitude prominences like the one (or more) seen by Wassenius are most common during what’s known as the “polar rush,” which occurs as solar activity rises toward a maximum. If these prominences are related to the polar rush, that would mean that in 1733, the Sun was not in an activity minimum as previously thought. However, it’s also possible for prominences to pop up at high latitudes during other times in the solar cycle; the authors estimated the likelihood of this happening at 20%.
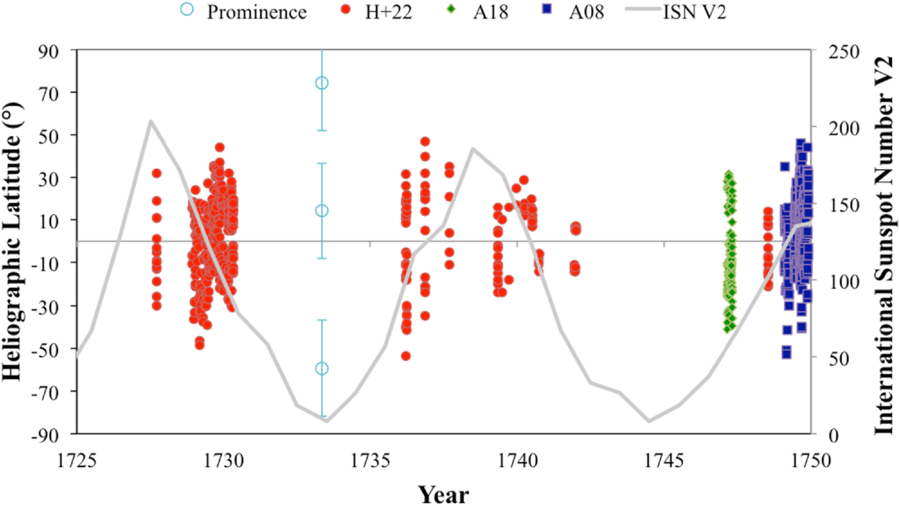
plot of positions and numbers of sunspots and solar prominences

Heliographic latitude of solar prominences estimated from Wassenius’s drawings (light blue circles), compared to the positions (filled symbols) and number (gray line) of sunspots. Note that sunspot data around this time were scarce, and some researchers have suggested that revisions to the sunspot number are needed. Click to enlarge. [Hayakawa et al. 2026]

This work shows the value of historical observations in determining the Sun’s past activity cycles. The 1733 eclipse observation by Wassenius adds a fascinating data point to the long history of solar eclipse observations, helping to illuminate a time when sunspot data were scarce.

Citation

“Analyses on Wassenius’s Report for Total Solar Eclipse in 1733: Quantifications of the Solar Radius and the Earliest Reported Prominences,” Hisashi Hayakawa et al 2026 ApJ 1007 189. doi:10.3847/1538-4357/ae6451

The post A New Look at a Centuries-Old Solar Eclipse appeared first on AAS Nova.
The August 12 Total Solar Eclipse: Where to See It—and Why NASA Is Flying Through Its Shadow

8 August 2026 at 00:02

On Wednesday, August 12, the Moon’s shadow will sweep across a narrow stretch of the Northern Hemisphere. Greenland, Iceland, northern Russia, the Atlantic, Spain and a small corner of Portugal lie in the path of totality. Much of Europe, northwestern Africa, Canada and parts of the United States will see a partial eclipse. It is […]

The post The August 12 Total Solar Eclipse: Where to See It—and Why NASA Is Flying Through Its Shadow appeared first on Curiosmos.

Featured Image: Citizen Science and Solar Structure

3 August 2026 at 17:00

solar corona during a solar eclipse

During the 8 April 2024 solar eclipse, the path of totality swept across North America, dazzling millions of skygazers. Scattered along this path were 82 viewing sites of the Dynamic Eclipse Broadcast Initiative citizen science project, which aimed to observe the dynamics of the tenuous solar corona. Though poor weather dashed many observers’ hopes, the project managed to collect data at 11 sites spanning 2,700 kilometers, capturing 49 minutes of coronal behavior. The image above shows the solar corona as seen during totality from one of the DEB Initiative sites. In a recent research article, Matthew J. Penn (Southern Illinois University Carbondale; Tucson Amateur Astronomy Association) and collaborators described the results of the Initiative’s viewing efforts, including identification of downflows and outflows, plumes, coronal loops, and apparent motion of background stars. To learn more about these observations of the solar corona, be sure to check out the full article linked below.

Citation

“Structure and Dynamics of the Inner Corona Measured from the DEB Initiative 2024 Eclipse Image Sequence,” Matthew J Penn et al 2026 ApJL 1006 L25. doi:10.3847/2041-8213/ae8797

The post Featured Image: Citizen Science and Solar Structure appeared first on AAS Nova.

How Solar Flares Hint That They’re About to Happen

1 December 2025 at 17:00

Images of a solar flare at different wavelengths

Forecasting solar flares is one of the major challenges facing solar physicists today. New research finds that non-thermal emission can precede a solar flare by more than an hour, and this early emission may signal whether the flare will be accompanied by an explosion of plasma.

Flare Flavors

photograph of a coronal mass ejection

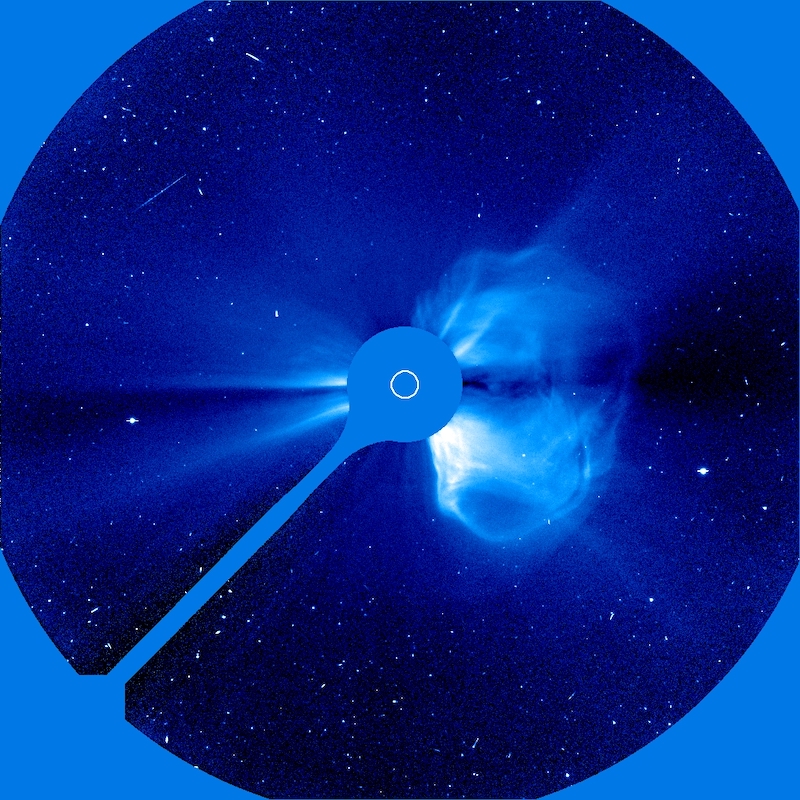
The Solar & Heliospheric Observatory (SOHO) took this coronagraphic image of a coronal mass ejection on 20 April 1998. [SOHO (ESA & NASA)]

Solar flares come in two basic flavors: eruptive and confined. Eruptive flares are accompanied by the launch of tangled clouds of plasma and magnetic fields called coronal mass ejections. Confined flares, so called because the solar plasma remains confined to the Sun, feature only a brief blast of high-energy radiation.

Both solar flares and coronal mass ejections can disrupt everyday life on Earth, with flares knocking out radio communications and coronal mass ejections threatening spacecraft electronics and power grids. Given these real-life risks, as well as the potential for probing the physics behind the activity on the Sun and other stars, it’s critical to be able to identify signs of upcoming flares.

Looking at the Lead-Up

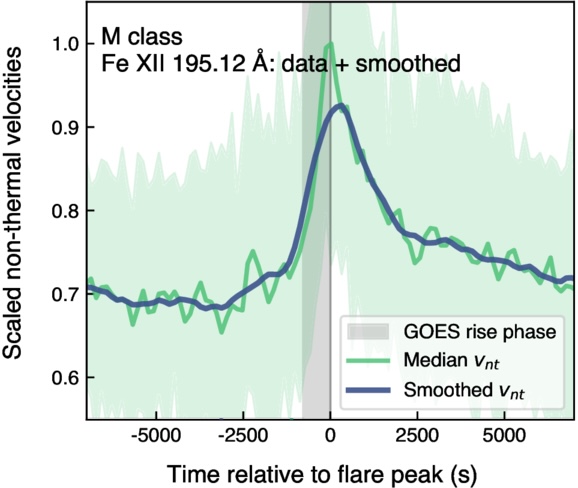
Luckily, there’s growing evidence that the Sun sends out subtle signals that a flare is soon to happen. One early sign of an impending flare is an increase in the non-thermal velocity of the plasma at the flare’s location. This phenomenon has been spotted in individual flares, but it hasn’t been studied and characterized for a large sample of flares — until now.

example of increasing non-thermal velocity before a solar flare

Demonstration of the increase in non-thermal velocity seen in an M-class flare compared to the onset and rise time of the soft X-ray flux (gray shaded area). [Adapted from To et al. 2025]

A recent research article led by Andy S. H. To (European Space Agency) takes the first systematic, large-scale approach to studying the non-thermal velocity changes that precede solar flares. The team amassed a sample of 1,449 solar flares that were seen by the Hinode spacecraft, the Geostationary Operational Environmental Satellite (GOES), and the Solar Dynamics Observatory (SDO). Hinode provided the spectral information needed to identify increases in the non-thermal velocity, GOES provided the flare start times, and SDO provided detailed information on the location and appearance of each flare.

Of the flares in the sample, 83% were moderately powerful C-class flares, 18% were stronger M-class flares, and 1% were the most powerful X-class flares. To’s team identified a clear trend across all types of flares: the non-thermal velocity increases 4–25 minutes before the flare’s X-ray emission begins to rise, peaks when the X-ray emission peaks, and decays as the flare decays. The team found some evidence that for smaller flares, the velocity increase begins in spectral lines that trace cooler plasma before spreading to lines probing hotter plasma, but more work is needed to confirm this trend.

More Details

Examples of flares with and without coronal mass ejections

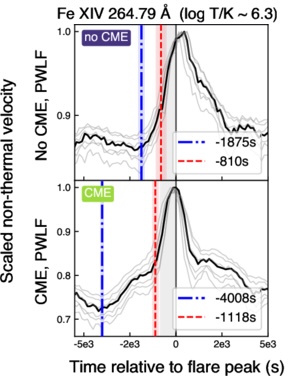
Examples of flares with and without coronal mass ejections. [Adapted from To et al. 2025]

Certain flares give even earlier hints of upcoming activity. M-class flares and some C-class flares exhibit what To’s team calls “precursor emission,” which emerges roughly 30–60 minutes before the flare’s X-ray emission peaks. The team also identified differences in precursor emission between confined and eruptive flares: eruptive flares display precursor emission over a broad range of spectral lines starting 45–74 minutes before the flare peaks, while confined flares show precursor emission later (31–54 minutes before peak) and in only a few spectral lines.

These results suggest that changes in the non-thermal velocity of solar plasma can not only signal when and where a flare is likely to arise, but also whether the flare will be accompanied by a potentially destructive coronal mass ejection. Upcoming missions like the Multi-slit Solar Explorer and SOLAR-C will give an even better view of the early stages of solar flares, helping to illuminate the physics behind them and enhancing our ability to forecast them.

Citation

“Systematic Nonthermal Velocity Increase Preceding Soft X-Ray Flare Onset: A Large-Scale Hinode/EIS Study,” Andy S. H. To et al 2025 ApJ 993 102. doi:10.3847/1538-4357/ae07de

The post How Solar Flares Hint That They’re About to Happen appeared first on AAS Nova.

❌