❌

Normal view

What night is van Gogh’s β€˜The Starry Night’? New analysis says it’s in July.

22 October 2026 at 16:00

The swirling bluish-white mistrals, towering cypress trees, and glittery stars in Vincent van Gogh’s β€œThe Starry Night” (1889) have captivated our imaginations for generations. Despite never selling a painting during his lifetime, van Gogh’s β€œThe Starry Night” has since inspired a hit song in 1972, draws visitors to the Museum of Modern Art in New York City, and adorns everything from journals to scarves and tote bags.

But what particular night above Saint-RΓ©my-de-Provence, France, did the troubled post-impressionist painter actually put on the canvas? A new analysis points to July 22, 1889. During the early morning hours at that time of year, a waning crescent moon, the planet Venus, and the Hyades star cluster in Taurus appeared close togetherβ€”all of which are seen in the painting. A study published today in the journal Scientific Reports details the findings.Β 

The story behind β€˜The Starry Night’

According to the Metropolitan Museum of Art, van Gogh was inspired by the view from his window at the Saint-Paul-de-Mausole asylum in southern France. He spent twelve months there 1889–1890, seeking reprieve from his mental illnesses and was also diagnosed with a form of epilepsy.Β 

Like many of his paintings that year, β€œThe Starry Night” was created in several sessions during the day, under different weather conditions. The village nestled below the hills was also based on other views, and could not be seen from his window. Although van Gogh reconstructed some of the features in the night sky as he saw them, he also altered the celestial shapes and added a sense of glow.

β€œVan Gogh assigned an emotional language to night and nature that took them far from their actual appearances,” the museum writes. β€œDominated by vivid blues and yellows applied with gestural verve and immediacy, β€˜The Starry Night’ also demonstrates how inseparable van Gogh’s vision was from the new procedures of painting he had devised, in which color and paint describe a world outside the artwork even as they telegraph their own status as, merely, color and paint.”

Looking to the stars

Using astronomy to pinpoint which day inspired the painting began with UCLA art historian Albert Boime in 1984 and Harvard University astronomer and astrophysicist Charles Whitney in 1986. The two scholars reached conflicting conclusions, and neither of them displaced the prevailing religious and symbolic interpretations of the painting.Β 

Historically, the painting has been dated based on a letter van Gogh wrote to his brother Theo around June 18, 1889. However, the waning gibbous moon from mid-June does not account for the slender crescent seen in the painting. By July 22, 1889, the Hyades star cluster rose in the eastern sky alongside Venus, and the moon’s shape looked closer to the crescent on the canvas. This new study uses observational geometry to find an answer.

β€œTo an observational astronomer, the cluster of stars in β€˜The Starry Night’ is the Hyades in Taurus,” said study co-author Elijah Jeong-hyun Kim.Β  β€œBut the moment I read the earlier studies explaining it as Aries, I heard the painting calling to me.” Kim is the CEO at South Korean robotic telescope company SLLAB and a PhD candidate at Kyung Hee University.

For this research, the team combined astronomical simulations and measurements of star positions, with historical weather records, and van Gogh’s own letters. They also used earlier sketches of the landscape to reconstruct the narrow field of view represented in β€œThe Starry Night.”

(A) The central cluster of stars in β€œThe Starry Night” (1889), left, and the Hyades cluster in Taurus, center. At right, the five stars in the painting (orange) are overlaid on the real stars (blue) after matching for size, orientation and position; red dashed lines show the residual differences. (B) The stars in β€œCafΓ© Terrace at Night” (1888), left, and the stars around the Summer Triangle, center. The panel at right follows the same layout as in (A). Image: Kim et al., Scientific Reports (2026), Figs. 2, 4 and S1.

According to the team, the crescent moon, Venus, and the Hyades star cluster in the constellation Taurus would have been visible around dawn on July 22, 1889. This configuration generally corresponds to what is portrayed in the painting. Weather records suggest that the night sky around July 22 would have been clear enough for this astronomical arrangement to be visible. Additionally, the frequent mentions of cicadas in van Gogh’s letters suggest that the region was seeing a period of hot weather, which matches the recorded temperatures in July 1889 better than in June.

The team also verified that the painter’s field of view in another painting titled β€œStarry Night over the RhΓ΄ne” (1888) with photographs taken on site was painted when the sky was in Aries. Using the same method, the team also believes that the stars in β€œCafΓ© Terrace at Night” (1888) may be the Summer Triangle.

β€œI hope this work prompts a renewed, multidisciplinary look at the sequence and working methods of the Saint-RΓ©my paintings, and at Van Gogh’s movements that summer,” Kim said. β€œOur conversation with Van Gogh’s other skies is still ongoing. We plan to tell those stories one by one.”

The post What night is van Gogh’s β€˜The Starry Night’? New analysis says it’s in July. appeared first on Popular Science.

Nurse-led urology clinic records 14,013 registrations in descriptive study

21 October 2026 at 23:17

A nurse-led chronic disease management clinic in the urology department of a tertiary hospital recorded 14,013 outpatient registrations between July 2024 and September 2026, according to a single-center retrospective descriptive study using routinely collected service records. The clinic primarily supported long-term management of patients with prostate and bladder cancer while also providing specialty nursing services for other urological conditions. Its follow-up system marked 3,547 of 3,553 assigned tasks as successful, a task-level success rate of 99.83%. These figures describe service activity and record completion; the study did not measure whether the clinic improved clinical outcomes or economic performance.

The clinic was established in July 2024 within the hospital’s existing specialty nursing outpatient service framework. Its operating model included staffing and qualification requirements, professional training, clearly defined nursing responsibilities, physician–nurse collaboration, standardized procedures, information-system support and quality management. Nurses worked within their authorized scope of practice, while urologists participated in medical assessment and treatment decisions when required. The service had four reported components: patient assessment and follow-up planning; treatment follow-up and adverse-event monitoring; rehabilitation guidance and health promotion; and assistance with healthcare policies and basic nursing care.

Monthly registrations increased from 147 in July 2024 to a peak of 710 in August 2026, with fluctuations during the reporting period. Total registration fees were CNY 152,758. The clinic delivered 14,246 prostate cancer-related injections, 3,523 urinary catheterizations, 2,777 intravesical instillation procedures and 2,142 urinary catheter removals. It also assisted patients with prostate or bladder cancer in applying for outpatient chronic and special disease insurance benefits. The study reports these counts as routine service activities, but it did not compare the procedures with those delivered elsewhere or evaluate their individual clinical effects.

Follow-up management was integrated into the clinic’s information system, which contained records for 1,111 patients. Of these, 953 patients had been followed up and 951 had successful follow-up records. Nurses also executed 3,553 follow-up tasks, of which 3,547 were successful, corresponding to the reported 99.83% task-level rate. The descriptive data do not specify the duration or effectiveness of patient follow-up, assess whether missed contacts influenced treatment adherence or health outcomes, or establish how the results would compare with another care model.

Because the research covered one tertiary hospital and relied on routinely collected records, it cannot establish how the clinic would operate in smaller facilities, under different staffing arrangements or in other health systems. The findings offer a documented example of a nurse-led outpatient service with defined responsibilities, standardized workflows, follow-up documentation and collaboration with urologists. The authors stated that further research is needed to evaluate the model’s clinical outcomes and economic implications. Accordingly, the registration growth, procedural workload and high proportion of completed follow-up tasks should be interpreted as descriptions of implementation and recorded service delivery, not as evidence of improved survival, fewer complications, lower costs or other patient benefits.

Subject of Research: Operation and service activity of a nurse-led chronic disease management clinic in hospital urology

Article Title: Development and implementation of a nurse-led chronic disease management clinic in the urology department of a tertiary hospital: a descriptive study

Article References: Liu, C., Xia, Y., Jia, X., Wang, R., Li, T., Ma, Y., & Long, H. (2026). Development and implementation of a nurse-led chronic disease management clinic in the urology department of a tertiary hospital: a descriptive study. BMC Nursing. https://doi.org/10.1186/s12912-026-05566-z

Image Credits: AI Generated

DOI: 10.1186/s12912-026-05566-z

Keywords: nurse-led care, urology, outpatient nursing, chronic disease management, prostate cancer, bladder cancer, patient follow-up, service implementation, descriptive study, Development, implementation, nurse-led

Longitudinal airflow suppresses train power-arc drift at low pressure

21 October 2026 at 23:11

Longitudinal airflow can sharply suppress the drifting and ablation of the electrical arc formed between a train’s pantograph and overhead contact wire, according to a modeling and experimental study of pantograph–catenary systems under low-pressure conditions. The researchers built a magnetohydrodynamic model that coupled electric, magnetic, thermal, fluid and arc-motion dynamics, then tested the method in a vacuum chamber with copper and carbon electrodes. In experiments conducted at atmospheric pressure, increasing the airflow to 45 metres per second reduced the measured arc drift height from 27.6 millimetres to zero and shortened the arc-root distance from 51.3 to 3.9 millimetres. The same airflow setting also produced progressively less carbon-electrode damage, supporting the proposal as a possible current-collection control method for railways operating at high altitude.

The need for such control arises because the pantograph–catenary system carries the electrical energy used by electric trains, while the stability of its contact strongly affects operating safety and efficiency. Lower atmospheric pressure presents a particularly difficult environment. The study notes that reduced air density and breakdown-field strength can lower the ignition threshold for pantograph–catenary arcs, increase their frequency and duration, and enlarge the region affected by arcing. Repeated arcing can cause irreversible high-temperature ablation and electrical wear on contact wires and pantograph strips. It can also generate broad-band electromagnetic interference that may affect onboard signalling and traction-control systems, with potential consequences including insulator flashover and disruption of the traction network. These background risks motivate efforts to understand and restrain the spatial movement of arcs in plateau environments.

Existing arc models include the Cassie and Mayr black-box approaches, which support analysis of interactions between arcs and traction-network circuits but do not represent an arc’s changing spatial shape. Magnetohydrodynamic models offer a more physical alternative by coupling electromagnetic, flow and thermal fields. Previous work represented crosswind effects on pantograph–catenary arcs and examined how decreasing pressure affects arc-root jumping, in which the root forms at a new location after the elongated column reaches a critical length. Other studies have shown that magnetic fields can stabilize welding and switching arcs. Airflow regulation, however, has been investigated more extensively in welding than in pantograph–catenary systems, whose dissimilar electrodes, high operating speed, open environment, changing electrode gap and constrained vehicle installation space make their arc dynamics more complicated.

The new model represents an arc initially 6 millimetres long and 2 millimetres in diameter between a copper anode and a carbon cathode. It includes the surrounding air, both electrodes and a central longitudinal-airflow channel beneath the copper electrode, including a 1.5-millimetre control-airflow inlet. A separate inlet represents train-induced airflow and was set to 40 metres per second. Calculations covered pressures of 101, 80 and 60 kilopascals, longitudinal airflow from zero to 80 metres per second and a total simulation time of 25 milliseconds. Air properties were adjusted with pressure, while the electrodes were assigned distinct densities, resistivities, thermal conductivities and heat capacities. The governing equations represented electrical potential and current, magnetic-vector potential, mass and momentum conservation, energy conservation, viscous dissipation, Joule heating and net volumetric radiation.

The calculations use several explicit simplifications. Arc ignition is omitted, and the plasma is treated as being in local thermodynamic equilibrium. Flow in the air and arc domains is assumed laminar and incompressible, while metal vapour generated by electrode evaporation and phase change is excluded. These assumptions make it possible to examine large-scale arc motion and temperature distribution but prevent the simulation from directly calculating electrode mass loss, crack width or crater area. Copper was assigned the anode and carbon the cathode; a Gaussian distribution represented current entering through the copper electrode, and the bottom of the carbon electrode was grounded. The air boundary was treated as magnetically insulated, and the initial temperatures were set to 300 kelvin for the air and electrodes and 5,000 kelvin for the arc domain. The experimental apparatus was separate from the numerical model and provided direct physical measurements of damage.

Without longitudinal airflow, the simulated arc passed through two stages. During the first 10 milliseconds, its column elongated continuously, bent under airflow influence, and developed greater drift height and arc-root distance. From 10 to 25 milliseconds, the column and root distance fluctuated through repeated shortening and elongation. The authors associate this behaviour with the electrical and mechanical limits of the arc: once a column reaches a critical length, the voltage and energy available between the electrodes may no longer sustain continuous burning, and a shorter path of lower resistance may form on the electrode surface. The resulting root β€œjump” shortened the column before airflow stretched it again. Arc development became faster and both drift height and root distance increased as pressure fell. Temperature briefly exceeded 10,000 kelvin and reached a maximum within roughly two to three milliseconds before fluctuating, while arc voltage rose as the column lengthened and resistance increased.

Longitudinal airflow changed these trajectories in the simulations. As speed increased, drift height, root distance and temperature all declined, with the greatest reductions occurring at lower airflow speeds before the curves began to level off. At 101 kilopascals, the calculated drift height fell from 37.5 millimetres without control airflow to zero at 45 metres per second, while root distance decreased from 57.3 to 3.7 millimetres and temperature dropped from 12,900 to 8,650 kelvin. The airflow needed to eliminate drift was 45, 40 and 35 metres per second at pressures of 101, 80 and 60 kilopascals, respectively; speeds required to bring root distance below 5 millimetres were 45, 40 and 30 metres per second. The authors attribute the stronger response at lower pressure to reduced plasma density, which weakens the arc’s inherent rigidity, Lorentz force and thermal buoyancy, allowing airflow load to become a more dominant influence on its motion.

The temperature response also revealed a practical plateau. The researchers defined the optimal airflow speed as the point after which increasing speed by 5 metres per second changes arc temperature by less than 3 per cent. At atmospheric pressure this occurred at 40 metres per second, compared with 30 metres per second at 60 kilopascals. The reported temperature reduction was 33.8 per cent at 101 kilopascals and 38.1 per cent at 60 kilopascals. Airflow strengthened convective heat removal, which lowered plasma temperature and, in turn, increased deionization and reduced Joule heating. Once thermal exchange approached saturation and the minimum temperature required for self-sustaining arc combustion was approached, further increases in speed produced little additional cooling. The model therefore indicates that the airflow speeds required for control decline as ambient pressure falls.

Laboratory testing used a vacuum chamber capable of controlling pressure with an accuracy of plus or minus 100 pascals, a constant-current supply rated from zero to 150 amperes, an arc igniter, a fan with continuously adjustable airflow from zero to 60 metres per second, a high-speed camera and an oscilloscope. Airflow at the electrode outlet was measured with an anemometer accurate to plus or minus 0.5 metres per second. The camera operated at 6,400 frames per second with an exposure of five microseconds, while each two-second arc test was repeated five times and the mean was reported. Tests at 101 kilopascals used airflow speeds of zero, 20, 30 and 45 metres per second. Without control airflow, high-speed images showed increasing arc drift. At 45 metres per second, drift was virtually absent during the final development phase and root distance was substantially shortened, with observed morphologies broadly consistent with the numerical results.

The experiments also found reductions in carbon-electrode ablation that increased with airflow speed. Microscopy showed shorter ablation areas, smaller craters and narrower crack propagation as the controlled airflow rose. The maximum crack width was 66.7 micrometres without airflow and decreased at higher speeds, while analytical weighing showed progressively less mass loss from the carbon electrode. The proposed mechanism is that stronger airflow promotes arc-root slippage, shortening the time the root remains at one point, while convective cooling lowers temperature and local energy density. These are experimental observations rather than direct outputs of the simulation: because the model omits electrode evaporation and metal-vapour transport, it cannot quantitatively predict ablation rates or near-electrode energy balances. The study therefore demonstrates reduced damage under its controlled laboratory conditions, not a complete first-principles calculation of all processes responsible for electrode wear or a proven field performance level in operating plateau railways.

Subject of Research: Experimental and numerical evaluation of airflow control of pantograph–catenary arcs at low pressure.

Article Title: Research on regulation method for suppression of pantograph-catenary arc by airflow in low-pressure environment

Article References: Xu, Z., Wang, S., Dong, K., & Gao, G. (2026). Research on regulation method for suppression of pantograph-catenary arc by airflow in low-pressure environment. iScience, 29(11), Article 117951. https://doi.org/10.1016/j.isci.2026.117951

Image Credits: AI Generated

DOI: 10.1016/j.isci.2026.117951

Keywords: pantograph–catenary systems, railway electrification, electric arcs, low-pressure environments, longitudinal airflow, magnetohydrodynamic modelling, electrode ablation, high-speed rail, plateau railways, arc suppression, Research, regulation

NASA closes the book on epic OSIRIS-REx asteroid-sampling mission: 'I am immensely proud of what we did'

20 October 2026 at 11:00

On Sept. 30, NASA formally concluded OSIRIS-REx, the historic first U.S. mission to pluck a pristine piece of an asteroid and deliver it safely back to Earth.

The van-sized OSIRIS-REx spacecraft β€” whose name is short for Origins, Spectral Interpretation, Resource Identification, Security-Regolith Explorer β€” visited and sampled Bennu, an ancient space rock holding pristine remnants from the dawn of our solar system more than 4.5 billion years ago. Among those cosmic relics are raw organic building blocks, the kind that may have seeded life on Earth.

"I have known this day was coming for a long time, but it is still difficult to see it arrive," OSIRIS-REx Principal Investigator Dante Lauretta, who's based at the University of Arizona, said in a post on LinkedIn. "I feel enormous pride in what we accomplished together, and real sadness that this journey has come to an end."

For the mission team, the farewell capped a decade of high-stakes engineering, on-the-fly troubleshooting and nail-biting close calls that ultimately delivered to Earth the largest asteroid sample ever collected in space, one that held secrets from the early solar system.

Long before launch, the team faced obstacles that nearly thwarted the endeavor β€” chiefly, two rejections from NASA β€” before finally securing the green light for the $1 billion project under the New Frontiers Program in 2011.

When OSIRIS-REx launched on Sept. 8, 2016, on a two-year journey across the inner solar system, Bennu was little more than a point of light in telescopes. Scientists expected the asteroid’s surface to be a smooth, sandy sphere where OSIRIS-REx could seamlessly touch down. Much to their surprise, however, when the probe arrived at the asteroid in late 2018, it revealed Bennu to be a treacherous, loosely bound amalgamation of jagged boulders.

"Our expectations about the asteroid's surface were completely wrong," Lauretta said in an Oct. 7 statement from the University of Arizona. "There was no obvious place to collect a sample anywhere."

When OSIRIS-REx touched down on a small crater named Nightingale, Bennu offered so little structural resistance that scientists said its surface reacted more like fluid than a hard, rocky shell. The spacecraft's sampling head sank directly into the asteroid, stopping after burrowing 20 inches (51 centimeters) deep by firing its thrusters at the right time to pull away, with the precious sample in hand.

A spacecraft's arm above a moving ground. It's black and white and the ground looks pebbled and rocky.

NASA's OSIRIS-REx spacecraft captured this series of images of asteroid Bennu on April 14, 2020, during the first rehearsal of the mission's sample collection event. The actual sample retrieval was extremely close to the way this looks. (Image credit: NASA/Goddard/University of Arizona)

Then came another nail-biting moment: The sample collector lid got jammed in a partially open position because so much material was scooped up, allowing fragments of the precious cargo to escape. In a race against time to prevent further loss, the mission team quickly stowed the sampler head directly inside the return capsule, securing the cosmic treasure for its journey back to Earth.

Even the final return to Earth, on Sept. 24, 2023, kept the team on edge: A parachute failed to deploy properly during reentry, forcing a tense but ultimately safe landing in the Utah desert.

"Successful exploration missions are not those that avoid surprises; they are those that are deliberately designed to adapt to them," Lauretta said in the statement, quoting a line from the mission's final report to NASA.

"That certainly describes OSIRIS-REx," he said. "Again and again, the mission presented us with circumstances we had not expected, and again and again, this team found a way forward."

The mission's triumphs began long before the samples reached Earth. For example, the probe set a Guinness World Record when it slid into orbit around the 1,610-foot-wide (490 meters) Bennu, which became the smallest object ever circled by a spacecraft.

The scientific payoff that followed included remote-sensing work that confirmed Bennu's surface is coated in carbon-bearing compounds. Those observations also revealed that Bennu was once part of a much larger, water-rich parent asteroid that shattered in a catastrophic collision in the main asteroid belt between Mars and Jupiter.

The returned sample β€” which weighs 4.29 ounces (121.6 grams) here on Earth, more than twice the mission's requirement β€” continues to thrill and occupy scientists.

A wave of research papers, now topping 200, continues to piece together the composition and history of the ancient space rock. Among other findings, Bennu's pristine material has revealed amino acids and sugars that, on Earth, are essential for life, alongside a history of exposure to liquid water that could have served as the "broth" for these compounds to interact.

More discoveries are likely to come. Most of the returned Bennu sample is being preserved for future generations of scientists, who will study it "with questions and instruments we cannot yet anticipate," Lauretta said in the statement.

Though its OSIRIS-REx chapter is closed, the spacecraft itself is far from retired. Renamed OSIRIS-APEX (OSIRIS-APophis EXplorer), the probe is using its remaining propellant to head toward Apophis, another near-Earth asteroid and a different type of space rock from Bennu. It is scheduled to arrive in 2029.

Japan launches mission to bring home a piece of the Martian moon Phobos

20 October 2026 at 06:59

Japan launched a $578 million mission Monday on a five-year expedition to land on the largest moon of Mars and retrieve samples for return to Earth, a daring international project that could yield new insights into the formation of the Solar System.

The robotic Martian Moons eXploration mission, known as MMX, lifted off at 3:41 pm EDT Monday (4:41 am Japan Standard Time Tuesday) from Tanegashima Space Center in southern Japan.

The MMX spacecraft rode into orbit atop a 207-foot-tall (63-meter) H3 rocket, Japan's flagship launch vehicle. The rocket assigned to MMX debuted a new souped-up configuration with four strap-on solid rocket boosters, full-throttle main engines, and an extended payload shroud to accommodate the demands of Japan's heaviest and most ambitious interplanetary mission to date.

Read full article

Comments

Β© ESA/DLR/FU Berlin/Andrea Luck

ESA’s Euclid Space Telescope Discovers Its First Comet

19 October 2026 at 22:38
This Euclid shows the comet C/2026 S1 (Euclid). Image credit: ESA / Euclid / Euclid Consortium / NASA / PΓΆntinen et al.

Officially named C/2026 S1 (Euclid), the comet turned up in images Euclid captured between September 16 and 24, 2026.

The post ESA’s Euclid Space Telescope Discovers Its First Comet appeared first on Sci.News: Breaking Science News.

The moon is shrinking. 10,000 cracks on the lunar surface reveal by how much

19 October 2026 at 20:00

The moon is shrinking, and scientists are narrowing in on exactly how much our natural satellite has dwindled over the years.

The moon is thought to have formed from a violent collision between a massive object and our young Earth roughly 4.5 billion years ago, and its interior is still gradually cooling off from this ancient collision. As it cools, the moon contracts, leading to a long, slow shrinking process. Now, in a new study, scientists think that they have figured out how much smaller the moon is actually getting.

In this new study, scientists analyzing images snapped by the Lunar Reconnaissance Orbiter Camera (LROC) have spotted over 10,000 young faults, or cracks across the moon's surface. This helped them to figure out how much the moon has contracted over time, and they now estimate that the moon's radius has decreased by about 148 feet (45 meters) over the past 400 to 800 million years.

"The number of these young faults revealed in LROC images is much greater than I ever imagined," study lead Thomas Watters, a geologist and scientist emeritus at the Center for Earth and Planetary Studies at the Smithsonian's National Air and Space Museum, said in a statement. "As the interior of the moon continues to cool and contract, it is expected that the growth of existing faults and formation of new faults continues today."

Lobate scarps on the moon.

Lobate scarps on the lunar surface, as seen by LROC. (Image credit: NASA/KARI/ASU/Intuitive Machines/SmithsonianΒ Β )

With these LROC observations, researchers in this study saw a variety of different types of cracks and landforms across the lunar surface. This included lobate scarps, or long, curved structures that form when the moon's surface contracts, cracks and is pushed upwards; and small mare ridges, or narrow "wrinkles" in the lunar surface, across the dark plains on the moon.

Lobate scarps on the moon.

Lobate scarps on the moon, as seen by LROC. (Image credit: NASA/KARI/ASU/Intuitive Machines/Smithsonian)

Tectonic activity on the moon looks a lot different than it does on Earth. On our own planet, there are about 15 major tectonic plates. On the moon, there are no tectonic plates at all. Instead, the moon has a single-plate body meaning its outer shell is a single piece only broken by faults or other such cracks created by the moon contracting. This means that instead of faults or cracks appearing at tectonic plate boundaries, they are instead scattered all over the moon.

A global map of lunar faults.

A global map of lunar faults. Red lines indicate over 8,900 lobate scarps while blue lines show over 2,000 small mare ridges. (Image credit: NASA/ASU/Intuitive Machines/Smithsonian)

By mapping these thousands of different features, all created from the moon cooling and contracting over time, the researchers are piecing together lunar history. In addition to finding the extent to which the moon has shrunk over time, they also found that some areas of the moon are covered in many more faults than other areas, and the areas with fewer cracks and faults have thicker moon crust.

This led them to conclude that not only are these areas with thicker crust more stable, but they suggest that a great deal of the widespread cracks in the lunar surface were created later in the moon's history as, in its earlier years, its thick crust would have insulated the moon's warm interior and prevented cooling, contracting and cracking.

This work was described in a study published Oct. 14 in The Planetary Science Journal.

Planetary Scientists Create Classification System and Map of Martian Soils

19 October 2026 at 15:48
Classification of realms across the Martian surface. Image credit: McBratney et al., doi: 10.1016/j.catena.2026.110649.

Planetary researchers at the University of Sydney have proposed a new way to classify the soils of Mars, along with a new word for them: areth (the name comes from Ares, the Greek name for Mars).

The post Planetary Scientists Create Classification System and Map of Martian Soils appeared first on Sci.News: Breaking Science News.

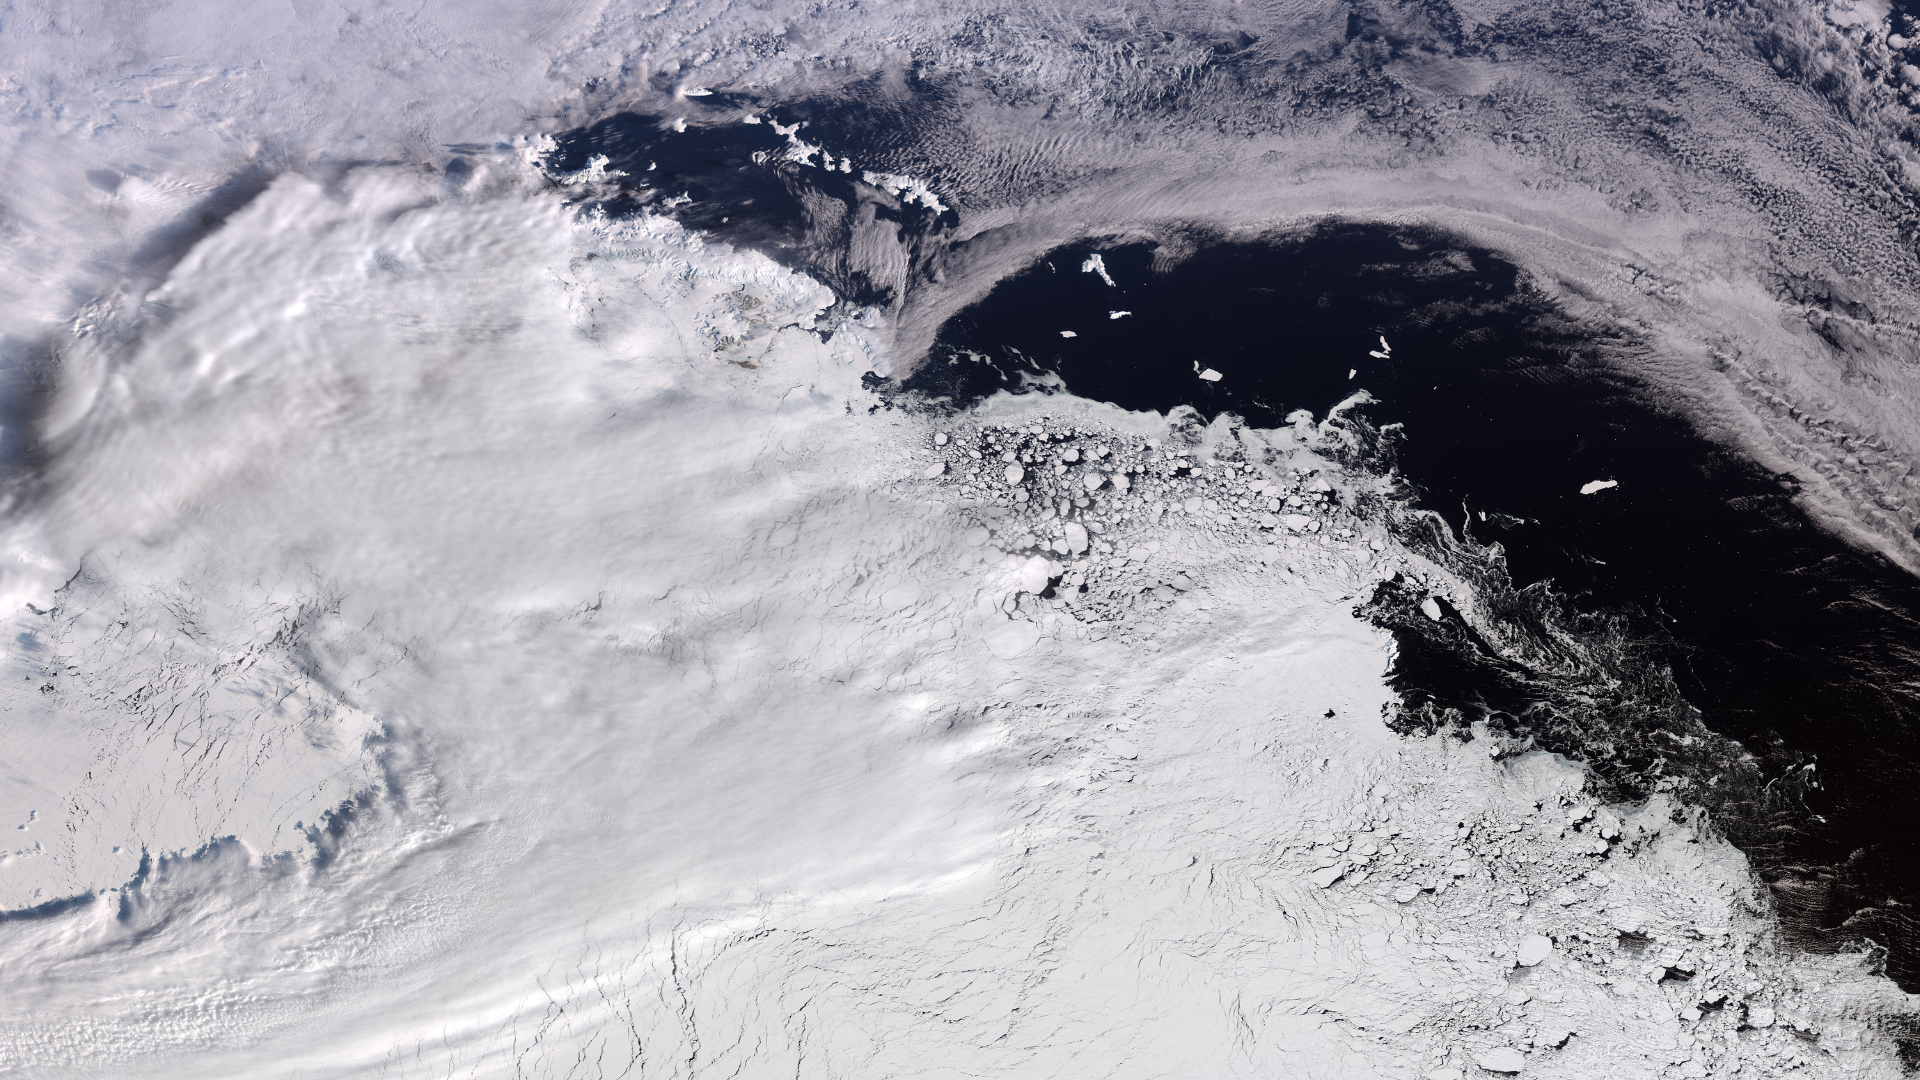
Elephant Island is an icy sight from orbit | Space photo of the day for Oct. 19, 2026

19 October 2026 at 15:00

Antarctica from space.

Ice floats by in West Antarctica as winter comes to an end in the Southern Hemisphere. (Image credit: contains modified Copernicus Sentinel data (2026), processed by ESA)

Antarctica is a magnificent sight, and that beauty is visible all the way from space.

What is it?

Orbiting planet Earth, the European Space Agency's (ESA) Copernicus Sentinel-3 mission captured a close-up of West Antarctica.

Winter is ending in the Southern Hemisphere, meaning this is the peak of icy weather and sea ice in the Arctic.

In this image snapped by Sentinel-3, you can see a massive swath of ice which includes Elephant Island on the left-hand side. An ice-covered island off the Antarctic coast, Elephant Island floats in the Southern Ocean. It got its name both from the island's shape, which some liken to that of an elephant's head, and the fact that the island is home to a community of elephant seals.

Why is it incredible?

While a seal-inhabited island on the left floats near the Antarctic coast, across the water is a vast, frozen landscape. In just this snapshot, you can see about between 746 and 1,056 miles (1,200 to 1,700 kilometers) of the icy continent.

This image was captured on Sept. 30, 2026. In the Southern Hemisphere, that was just past the end of winter. The absolute peak for sea ice in Antarctica fell just a couple weeks before, on Sept. 14, according to the National Snow and Ice Data Center, ESA reported.

So in this one snapshot, we can see a near-maximum for sea ice in the Antarctic, spanning hundreds of miles. In observing our own planet from space, we are able to peer across vast landscapes, capturing important observational data. This is especially critical for the Antarctic as, with the progression of climate change, this sea ice continues to dwindle, adding to sea level rise among other serious consequences across the planet.

Did a giant object collide with Earth to form the moon?

19 October 2026 at 13:00

For as long as humans have watched the night sky, we have wondered about the moon, pondering everything from its alien appearance to its influence over phenomena on Earth such as ocean tides, climate stability, and even the natural rhythms of many organisms.

Among the many questions we have about Earth's lone natural satellite, one remains preeminent: what are the moon's origins, and how long has it orbited Earth?

Today, the leading theory among astronomers is that deep in our planet's past β€” perhaps within roughly the first 100 million years of solar system history β€” Earth collided with a planet-sized object, creating the moon within a period that may have been as short as just a few hours. Known as the giant-impact hypothesis, this proposed event involves a hypothetical Mars-sized protoplanet astronomers call Theia. The material ejected into orbit by the powerful impact in question would have accumulated afterward, forming the moon that we observe today.

What do we know?

Birth of a lunar origin hypothesis

The evolution of this striking solution to one of the moon's most enduring mysteries goes back to 1946, when geologist Reginald Aldworth Daly was among the first to suggest that an impact event might explain the formation of the moon.

Before Daly, scientists had been leaning toward theories that involved Earth's rapid spin billions of years ago, when each day may have at one time lasted as little as 2 or 3 hours. Decades later in the 1970s, researchers William Hartmann and Donald Davis developed their own models involving collisions of large bodies left over from planetary formation, which could collide with younger planets.

Building on such ideas, other researchers went on to propose similar scenarios between the early Earth and a Mars-sized object. Early in the following decade, the concept eventually claimed its place as the leading lunar-formation process during a landmark conference held in Kona, Hawaii, in 1984.

two large orbs collide, creating an explosion of fire and large rocky objects

Earth's moon is thought to have formed when a Mars-sized object, called Theia, slammed into the proto-Earth more than 4.4 billion years ago, blasting out material that later coalesced into a large satellite as depicted in this artist's illustration. (Image credit: NASA/JPL-Caltech)

Evidence of a planetary-scale collision

The popularity of the giant-impact hypothesis can be attributed to the multiple lines of evidence supporting the impact scenario. For instance, researchers have long recognized the similar stable-isotope ratios between both moon rocks and those from Earth, strongly suggesting a link between their origins.

Additionally, the unusually high angular momentum (or spin) of the Earth-moon system, when compared to observations of other rocky planets, also could be explained as one of the effects of a massive collision.

Further clues can be found in the moon's composition, which reveals a relatively small iron core and lower density. This is significant to astronomers, since a hypothetical giant impact would have seen the suspected Theia protoplanet's metallic core merging with the young Earth's interior β€” meanwhile, lighter mantle and crust material from both worlds would have become dislodged and blasted into orbit, eventually helping form the moon.

Another important piece of evidence involves the relative depletion of volatile substances (a chemical that easily turns into gas or vapor at room temperatures) in lunar material, which again suggests that it might have been lost during an extremely energetic event, an idea further supported by evidence that the early moon once possessed a substantial magma ocean.

an ocean of magma on the moon

Illustration of the young Earth-Moon system. The Earth had recently formed when it was struck by a protoplanet, called Theia, roughly three times the size of Mars. Debris from the impact went into orbit where it quickly coalesced to form the Moon, probably within just a few thousand years. Initially the Earth and moon were much closer together than they are now, and spinning more quickly. In this depiction, debris from the collision continues to rain down on both worlds. (Image credit: Mark Garlick/Science Photo Library/Getty Images)

What remains unknown?

New research expands on the Theia hypothesis

Still, several significant questions remain, including what precise conditions led to the impact, and how the resulting planetary material evolved into the moon as it appears today.

Recently, a new study by Adeene Denton of Southwest Research Institute and colleagues at the University of Arizona's Lunar and Planetary Laboratory put a new spin on the Theia hypothesis, suggesting that the suspected ancient impact may have been significantly influenced by the heat and physical strength of the two colliding bodies.

The team's findings challenge some long-held views about the giant-impact hypothesis, while lending new support to others. For instance, the team's simulations revealed that while some impacts lead to the creation of a disk of debris that later coalesces into a moon, under other conditions, simulations support the idea that the moon could have been formed in a remarkably short period of time β€” perhaps within around five hours.

However, one of the primary issues with determining the exact conditions of the giant-impact hypothesis involves the ongoing debate over the moon's age.

"There is a large controversy regarding the age of the moon," said Dr. Erik Asphaug, a planetary science professor at the University of Arizona's Lunar and Planetary Laboratory and one of the new study's co-authors.

A view of the moon in the foreground with a small Earth in the background.

Earth sets over the moon's curved limb in this photo captured by the Artemis II crew during their journey around the far side of the moon. (Image credit: NASA)

In an email to Space, Asphaug explained some of the issues arising from this, since current estimates place the timing of the moon's formation anywhere from around 40 to 120 million years after the formation of the solar system. Therein lies part of the issue, according to Asphaug, who says this timing could have significant implications for models of the Theia impact.

If it had been an earlier collision, Asphaug says this would have involved a hotter Theia due to the greater degree of radiogenic heating; by contrast, a later impact would have meant a cooler and stronger Theia.

"I don't think we know enough yet to say the moon (and by corollary, the Earth) formed this way or that way," Asphaug told Space. "But knowing how temperature affects the result opens up a new dimension for viewing the problem, and that is always helpful because it shifts our frame of reference, like getting out of the car to have a walk around."

A lunar enigma in time and space

For researchers like Asphaug, understanding the moon's formation requires looking at it as more than just an event in space, but also as one in time. Doing so allows comparisons between three different metrics: isotopic decay, temperature-dependent material strength, and the geological record of debris striking other planets β€” a process through which he believes tighter constraints could be placed on precisely when the moon-forming impact might have occurred.

Adeene Denton, the study's lead author, also emphasized the introduction of the time component her team's research brings to the table, telling Space in an email that the outcome of the moon-forming impact could have depended significantly on the timing of the collision.

"Before, scientists have generally assumed that the outcome of the collision will be the same regardless of when it takes place," Denton wrote. "But now we know that temperature's effect on material properties, which is dictated by how old and/or cold the proto-Earth and Theia might be, alters things substantially."

By connecting impact simulations to data related to the moon's geochemical record, as well as models of early solar system formation, Denton thinks her team's work could help scientists better constrain precisely how and when the moon formed.

The mystery continues

For now, in terms of which possible scenario β€” an earlier or later collision event β€” emerges as being the most likely, Denton says it's still difficult to say.

"It depends on which scenarios for solar system formation you favor," Denton told Space.

"I am generally in favor of an earlier formation of the moon, consistent with a rapid planet-building phase in our solar system," Denton said, "but we can't neglect the possibility that the moon formed late."

While much work remains to be done, Denton and Asphaug believe their findings help significantly advance present efforts to resolve some of the questions about the giant-impact hypothesis β€” a few of which have lingered now for many years.

For Asphaug, however, such lingering questions may simply be part of the scientific process.

"Science has a way of wandering around for a long time until finally it all comes to focus," Asphaug said.

"I believe that will happen, in part thanks to this work, in the coming decade."

Webb and Spitzer Telescopes Explore the Planets That Never Were

19 October 2026 at 13:00

Planetesimal wrecks are raging around distant stars. With the Webb and Spitzer Space Telescopes, astronomers are learning what that looks like.

The post Webb and Spitzer Telescopes Explore the Planets That Never Were appeared first on Sky & Telescope.

Stratospheric airship flew from US to Japan to test sky cell tower concept

19 October 2026 at 12:05

Nearly 100 years after the dirigible Graf Zeppelin made the first nonstop airship journey across the Pacific Ocean, another airship has successfully completed a round-trip flight from New Mexico to Japan and back. But the significance of this modern feat was less about the journey's length and more about its purpose: demonstrating how a lighter-than-air platform can act as a cell phone tower in the sky.

The trans-Pacific flight that took place over a month between August and September 2026 was the most notable milestone yet for Sceye, a US aerospace company based near Albuquerque, New Mexico. Sceye has developed an uncrewed platform filled with helium for buoyancy and equipped with an electric-powered propeller for active propulsion, allowing it to resist most strong winds and keep hovering over the same location for long periods. The platform also uses top-mounted solar panels and onboard batteries to stay powered for stratospheric operations around the clock.

β€œWe can stay over an area of operation, and we do that in the stratosphere right around 60,000 feet, so we're twice as high as air traffic and we're above the jet stream, and yet 30 times closer than low-Earth orbit satellites,” Mikkel Frandsen, founder and CEO of Sceye, told Ars. β€œWe can fly through day and night until the sun comes up the next morning and recharges the batteries, at which point we're still at the same altitude and still over the same area of operation.”

Read full article

Comments

Β© Sceye

Engineer builds tiny 3D-printed single-motor drone in their bedroom

A software engineer who’s also into drones and 3D printing has shared a single-motor drone that they built inside their home and tested on their bed. Joshua Bird shared a video of how they created it on YouTube, highlighting the unique technique they used to maintain controllability and stability. The design used a combination of a hinged propeller, rapid changes to the motor’s rotation speed, and a custom flight controller and motor controller firmware that allowed the motor to react to necessary changes in under 0.2 milliseconds.

Most rotary wing aircraft require a mechanism to counteract the torque generated by the motor or engine and to change its flight direction, typically with the use of a swash plate to change rotor disk attitude and a secondary propeller. While this method has been effective for decades, it has made rotary-wing aircraft heavier and more complex. This single-motor drone cut the need for a secondary mechanism by constantly adjusting the speed of the motor β€” speeding it up produces more reaction torque while slowing it down applies opposite reaction torque. This essentially turns into a balancing act between these two forces to reduce the torque on the drone body to a more manageable level.

The hinged rotor also relies on the same mechanism for directional control instead of relying on a swashplate. Each rotor blade sits on a 45-degree hinge that makes it pivot when the motor accelerates. As this happens, one blade pitches up to produce more lift, while the other blade pitches down, reducing lift. By accelerating and decelerating the motor as needed, Bird would be able to change the drone’s roll and pitch movement. It also combines this with the main rotor torque, motor adjustments, and the 3D-printed stabilizing fins to produce effective yaw control as well.

This was the theoretical part β€” the majority of the build video focused on fixing issues, including the part where Bird built a high-speed camera using a Sony camera and a flash unit controlled by a microcontroller that gets its signals from the prototype drone’s motor controller and camera shutter. This home-made high-speed camera revealed that the drone’s propellers were too soft and had to be replaced with a 3D-printed version that used sturdier filament.

The creator had to launch several test flights from their bed, many of which resulted in a crashed drone and some wall damage as they fine-tuned the drone’s programming. Bird was eventually able to make the 3D-printed drone fly, although it was limited to the bedroom because of its fixed-base IR beacon navigation method. They said that they eventually want to add a linear camera to the build so that it could take off in other environments in the future.

While other researchers and engineers have built smaller, quieter drones, with China even revealing a mosquito-sized unit, Joshua Bird’s single-motor project is still a unique take on drones. But what made the YouTube video much more interesting is the problem-solving process and the solutions that came afterward. You can check out the complete video below and even start your own similar project by looking at the Single Propeller Drone GitHub repository.

❌